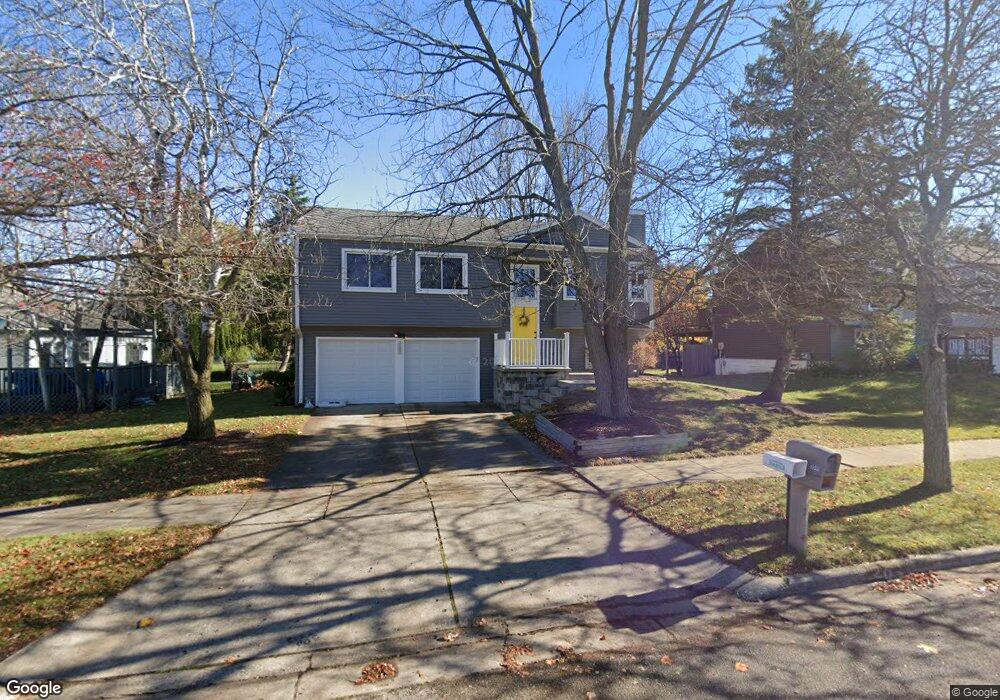
3515 Callihan Ct Lansing, MI 48910
Forest View NeighborhoodEstimated Value: $200,000 - $212,000
3
Beds
1
Bath
1,027
Sq Ft
$201/Sq Ft
Est. Value
About This Home
This home is located at 3515 Callihan Ct, Lansing, MI 48910 and is currently estimated at $206,746, approximately $201 per square foot. 3515 Callihan Ct is a home located in Ingham County with nearby schools including Forest View School, Pattengill Academy, and Eastern High School.
Ownership History
Date
Name
Owned For
Owner Type
Purchase Details
Closed on
Dec 26, 2008
Sold by
Secretary Of Housing & Urban Development
Bought by
Flores Janelle
Current Estimated Value
Purchase Details
Closed on
Jun 13, 2008
Sold by
Wells Fargo Bank Na
Bought by
Hud
Purchase Details
Closed on
Sep 13, 2007
Sold by
Shelley James and Shelley Elizabeth
Bought by
Wells Fargo Bank Na
Purchase Details
Closed on
Dec 29, 2000
Sold by
Frasco Daniel R and Frasco Jenny M
Bought by
Shelley James and Shelley Elizabeth
Home Financials for this Owner
Home Financials are based on the most recent Mortgage that was taken out on this home.
Original Mortgage
$107,945
Interest Rate
7.77%
Mortgage Type
FHA
Purchase Details
Closed on
Nov 16, 1996
Sold by
Alvarado Reynaldo and Alvarado Staci A
Bought by
Frasco Daniel
Create a Home Valuation Report for This Property
The Home Valuation Report is an in-depth analysis detailing your home's value as well as a comparison with similar homes in the area
Home Values in the Area
Average Home Value in this Area
Purchase History
| Date | Buyer | Sale Price | Title Company |
|---|---|---|---|
| Flores Janelle | $77,686 | None Available | |
| Hud | -- | Itc | |
| Wells Fargo Bank Na | $120,634 | None Available | |
| Shelley James | $108,000 | Metropolitan Title Company | |
| Frasco Daniel | $88,000 | -- |
Source: Public Records
Mortgage History
| Date | Status | Borrower | Loan Amount |
|---|---|---|---|
| Previous Owner | Shelley James | $107,945 |
Source: Public Records
Tax History
| Year | Tax Paid | Tax Assessment Tax Assessment Total Assessment is a certain percentage of the fair market value that is determined by local assessors to be the total taxable value of land and additions on the property. | Land | Improvement |
|---|---|---|---|---|
| 2025 | $3,164 | $80,700 | $9,700 | $71,000 |
| 2024 | $25 | $84,000 | $9,700 | $74,300 |
| 2023 | $2,966 | $75,400 | $9,700 | $65,700 |
| 2022 | $2,673 | $68,500 | $9,700 | $58,800 |
| 2021 | $2,618 | $62,700 | $7,700 | $55,000 |
| 2020 | $2,602 | $61,300 | $7,700 | $53,600 |
| 2019 | $2,494 | $58,100 | $7,700 | $50,400 |
| 2018 | $2,337 | $47,900 | $7,700 | $40,200 |
| 2017 | $2,238 | $47,900 | $7,700 | $40,200 |
| 2016 | $2,162 | $41,500 | $7,700 | $33,800 |
| 2015 | $2,162 | $38,600 | $15,490 | $23,110 |
| 2014 | $2,162 | $38,400 | $9,234 | $29,166 |
Source: Public Records
Map
Nearby Homes
- 2017 Greenwich Ct Unit 20
- 3116 Manley Dr
- 2127 Robinson Rd
- 3527 Ruth Ave
- 2710 Stoneleigh Dr
- 2710 Geert Ct
- 2015 Forest Rd
- 2110 Worden St
- 2018 Worden St
- 000 Dunckel Rd
- 0 N Aurelius Rd
- 3907 Glenwood Ave
- 2237 Sunnyside Ave
- 1101 Kendon Dr
- 0 Glenwood Ave
- 4608 Alpha St
- 3603 Parkway Dr
- 810 Fenton St
- 4719 S Pennsylvania Ave
- 817 Jessop Ave
- 2224 E Provincial House Dr
- 2320 Artisan Dr
- 2310 Artisan Dr
- 3535 Callihan Ct
- 0 Provincial House Dr
- 2300 Artisan Dr
- 3510 Callihan Ct
- 2400 Artisan Dr
- 3520 Callihan Ct
- 3601 Callihan Ct
- 2200 E Provincial House Dr
- 3530 Callihan Ct
- 3600 Callihan Ct
- 3615 Callihan Ct
- 2408 Artisan Dr
- 2405 Artisan Dr
- 3610 Callihan Ct
- 2322 E Provincial House Dr
- 2225 E Provincial House Dr
Your Personal Tour Guide
Ask me questions while you tour the home.