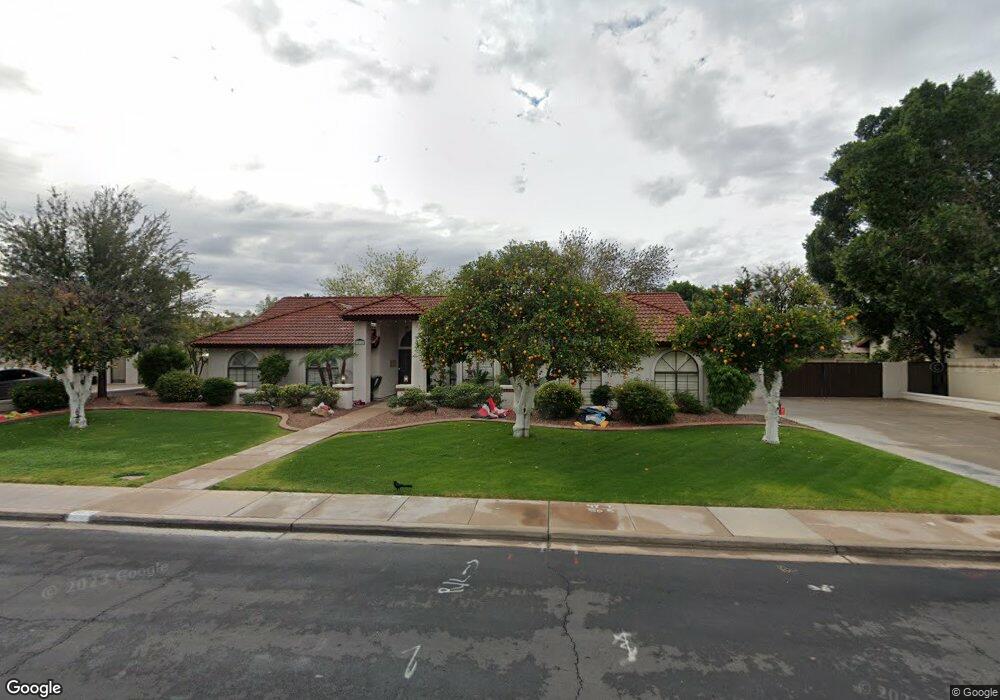
3515 E Fairfield Cir Mesa, AZ 85213
The Groves NeighborhoodEstimated Value: $726,967 - $800,000
Studio
3
Baths
2,612
Sq Ft
$297/Sq Ft
Est. Value
About This Home
This home is located at 3515 E Fairfield Cir, Mesa, AZ 85213 and is currently estimated at $774,742, approximately $296 per square foot. 3515 E Fairfield Cir is a home located in Maricopa County with nearby schools including Highland Elementary School, Franklin at Brimhall Elementary School, and Franklin West Elementary School.
Ownership History
Date
Name
Owned For
Owner Type
Purchase Details
Closed on
Nov 4, 2021
Sold by
Eagleburger Matthew
Bought by
Eagleburger Casey
Current Estimated Value
Purchase Details
Closed on
Nov 18, 2020
Sold by
Eagleburger Ann
Bought by
Eagleburger Ann and Eagleburger Casey
Purchase Details
Closed on
Mar 17, 1997
Sold by
Lyons James L and Lyons Lisa A
Bought by
Eagleburger David G and Eagleburger Ann B
Home Financials for this Owner
Home Financials are based on the most recent Mortgage that was taken out on this home.
Original Mortgage
$164,000
Interest Rate
7.63%
Mortgage Type
New Conventional
Purchase Details
Closed on
Nov 29, 1994
Sold by
Karim Emil S and Karim Hiam
Bought by
Lyons James L and Lyons Lisa A
Home Financials for this Owner
Home Financials are based on the most recent Mortgage that was taken out on this home.
Original Mortgage
$145,500
Interest Rate
6.25%
Mortgage Type
New Conventional
Create a Home Valuation Report for This Property
The Home Valuation Report is an in-depth analysis detailing your home's value as well as a comparison with similar homes in the area
Home Values in the Area
Average Home Value in this Area
Purchase History
| Date | Buyer | Sale Price | Title Company |
|---|---|---|---|
| Eagleburger Casey | $279,000 | None Available | |
| Eagleburger Ann | -- | None Listed On Document | |
| Eagleburger David G | $205,000 | Chicago Title Insurance Co | |
| Lyons James L | $181,900 | Transamerica Title Ins Co |
Source: Public Records
Mortgage History
| Date | Status | Borrower | Loan Amount |
|---|---|---|---|
| Previous Owner | Eagleburger David G | $164,000 | |
| Previous Owner | Lyons James L | $145,500 |
Source: Public Records
Tax History
| Year | Tax Paid | Tax Assessment Tax Assessment Total Assessment is a certain percentage of the fair market value that is determined by local assessors to be the total taxable value of land and additions on the property. | Land | Improvement |
|---|---|---|---|---|
| 2025 | $3,730 | $43,178 | -- | -- |
| 2024 | $3,743 | $41,121 | -- | -- |
| 2023 | $3,743 | $54,470 | $10,890 | $43,580 |
| 2022 | $3,654 | $43,920 | $8,780 | $35,140 |
| 2021 | $3,701 | $37,680 | $7,530 | $30,150 |
| 2020 | $3,650 | $35,560 | $7,110 | $28,450 |
| 2019 | $3,386 | $33,700 | $6,740 | $26,960 |
| 2018 | $3,230 | $33,630 | $6,720 | $26,910 |
| 2017 | $3,130 | $34,800 | $6,960 | $27,840 |
| 2016 | $3,072 | $35,030 | $7,000 | $28,030 |
| 2015 | $2,897 | $31,900 | $6,380 | $25,520 |
Source: Public Records
Map
Nearby Homes
- 1102 N Val Vista Dr Unit 37
- 3428 E Encanto St
- 3532 E Fairbrook Cir
- 3423 E Fairbrook St
- 3342 E Fox St
- 3458 E Adobe St
- 3637 E Ellis St
- 3048 E Elmwood St
- 3739 E Enrose St
- 3160 E Enrose St
- 3203 E Ellis St
- 3721 E Adobe St
- 3856 E Fairfield St
- 3716 E Dartmouth St
- 3746 E Dartmouth St
- 3931 E Fox Cir
- 1457 N Citrus Cove Cir
- 1126 N Nassau
- 3126 E Gary St
- 625 N 38th St
- 3505 E Fairfield St
- 3527 E Fairfield Cir
- 3514 E Encanto St
- 3520 E Fairfield Cir
- 3526 E Encanto St
- 3508 E Fairfield St
- 3535 E Fairfield Cir
- 3528 E Fairfield Cir Unit 4
- 3453 E Fairfield St
- 3502 E Fairfield St
- 3538 E Encanto St
- 3513 E Encanto St
- 3521 E Fountain St
- 3450 E Encanto St
- 3525 E Encanto St
- 3507 E Fountain Cir Unit IV
- 3507 E Encanto St
- 3542 E Fairfield Cir
- 3529 E Fountain St
- 3547 E Fairfield Cir Unit IV
Your Personal Tour Guide
Ask me questions while you tour the home.