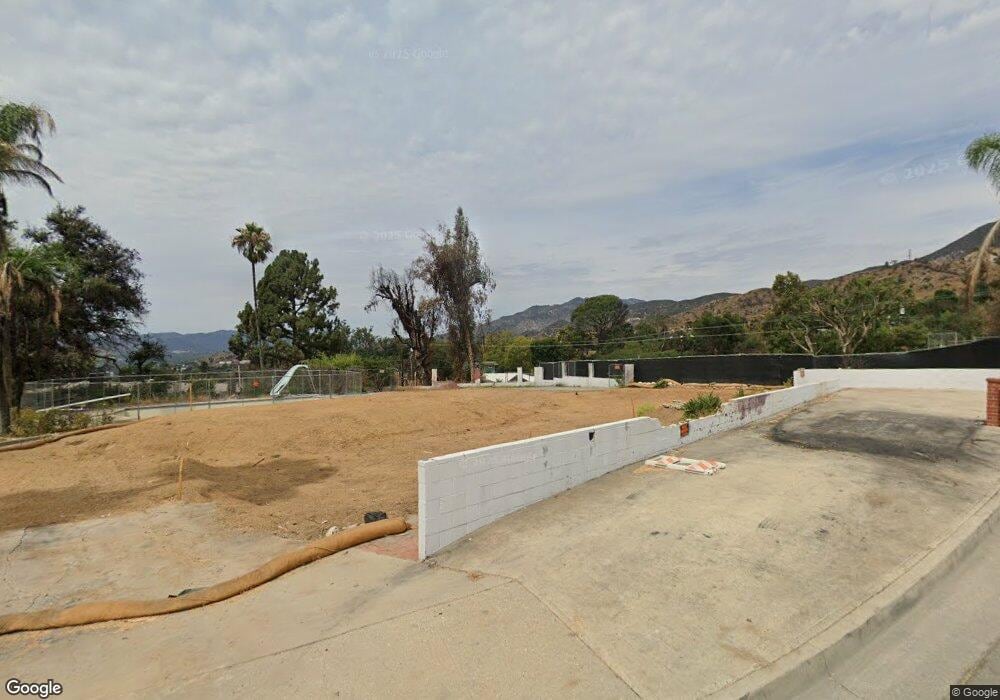
3515 Loma View Dr Altadena, CA 91001
Estimated Value: $800,000 - $1,830,322
3
Beds
3
Baths
2,812
Sq Ft
$430/Sq Ft
Est. Value
About This Home
This home is located at 3515 Loma View Dr, Altadena, CA 91001 and is currently estimated at $1,209,107, approximately $429 per square foot. 3515 Loma View Dr is a home located in Los Angeles County with nearby schools including Charles W. Eliot Arts Magnet Academy, John Muir High School, and Cleveland Elementary.
Ownership History
Date
Name
Owned For
Owner Type
Purchase Details
Closed on
Aug 17, 1998
Sold by
Storms Bonnie D
Bought by
Thompson Talford E and Thompson Laura D
Current Estimated Value
Home Financials for this Owner
Home Financials are based on the most recent Mortgage that was taken out on this home.
Original Mortgage
$170,000
Outstanding Balance
$34,427
Interest Rate
6.88%
Estimated Equity
$1,174,680
Purchase Details
Closed on
Dec 6, 1995
Sold by
Storms James C and Storms Bonnie D
Bought by
Storms Bonnie D
Home Financials for this Owner
Home Financials are based on the most recent Mortgage that was taken out on this home.
Original Mortgage
$100,000
Interest Rate
7.47%
Create a Home Valuation Report for This Property
The Home Valuation Report is an in-depth analysis detailing your home's value as well as a comparison with similar homes in the area
Home Values in the Area
Average Home Value in this Area
Purchase History
| Date | Buyer | Sale Price | Title Company |
|---|---|---|---|
| Thompson Talford E | $170,000 | Progressive Title Company | |
| Storms Bonnie D | $93,000 | Southland Title Company |
Source: Public Records
Mortgage History
| Date | Status | Borrower | Loan Amount |
|---|---|---|---|
| Open | Thompson Talford E | $170,000 | |
| Previous Owner | Storms Bonnie D | $100,000 |
Source: Public Records
Tax History
| Year | Tax Paid | Tax Assessment Tax Assessment Total Assessment is a certain percentage of the fair market value that is determined by local assessors to be the total taxable value of land and additions on the property. | Land | Improvement |
|---|---|---|---|---|
| 2025 | $2,617 | $24,359 | $24,359 | -- |
| 2024 | $2,617 | $146,559 | $36,741 | $109,818 |
| 2023 | $2,493 | $143,686 | $36,021 | $107,665 |
| 2022 | $2,420 | $140,869 | $35,315 | $105,554 |
| 2021 | $2,189 | $138,108 | $34,623 | $103,485 |
| 2020 | $2,125 | $136,692 | $34,268 | $102,424 |
| 2019 | $2,121 | $134,013 | $33,597 | $100,416 |
| 2018 | $1,967 | $131,387 | $32,939 | $98,448 |
| 2016 | $1,871 | $126,287 | $31,661 | $94,626 |
| 2015 | $1,851 | $124,391 | $31,186 | $93,205 |
| 2014 | $1,832 | $121,956 | $30,576 | $91,380 |
Source: Public Records
Map
Nearby Homes
- 3371 Fair Oaks Ave
- 168 Purple Sage Ln
- 3567 Glenrose Ave
- 3718 El Sereno Ave
- 150 Jaxine Dr
- 0 Jaxine Dr
- 3313 Alicia Ave
- 163 E Loma Alta Dr
- 3771 Alzada Rd
- 242 Taos Rd
- 3679 Fair Oaks Ave
- 50 Marathon Rd
- 3689 Fair Oaks Ave
- 3696 Chaney Trail
- 0 Alzada Rd
- 236 E Loma Alta Dr
- 70 W Las Flores Dr
- 271 E Loma Alta Dr
- 344 W Loma Alta Dr
- 294 Wapello St
- 3470 Loma Crest Dr
- 3521 Loma View Dr
- 3484 Loma Crest Dr
- 3500 Loma View Dr
- 3514 Loma View Dr
- 3490 Loma View Dr
- 3480 Loma View Dr
- 3483 Loma Crest Dr
- 3460 Loma View Dr
- 3475 Loma Crest Dr
- 3650 Glenrose Ave
- 3640 Glenrose Ave
- 3526 Loma View Dr
- 3449 Fair Oaks Ave
- 3670 Glenrose Ave
- 3632 Glenrose Ave
- 3455 Loma View Dr
- 3445 Fair Oaks Ave
- 3471 Fair Oaks Ave
- 3624 Glenrose Ave
Your Personal Tour Guide
Ask me questions while you tour the home.