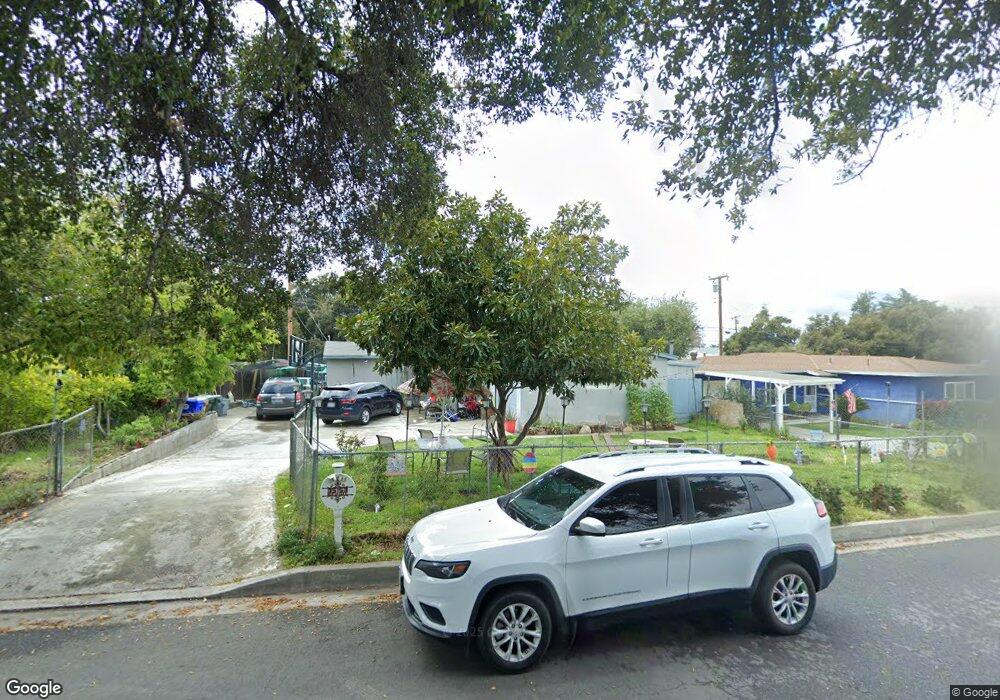
35153 Mountain View St Yucaipa, CA 92399
Estimated Value: $458,000 - $472,946
4
Beds
2
Baths
1,278
Sq Ft
$364/Sq Ft
Est. Value
About This Home
This home is located at 35153 Mountain View St, Yucaipa, CA 92399 and is currently estimated at $464,737, approximately $363 per square foot. 35153 Mountain View St is a home located in San Bernardino County with nearby schools including Wildwood Elementary School, Mesa View Middle School, and Yucaipa High School.
Ownership History
Date
Name
Owned For
Owner Type
Purchase Details
Closed on
Jan 10, 2024
Sold by
Parra Juan Vazquez and Parra Hortensia
Bought by
Parra Family Trust and Parra
Current Estimated Value
Purchase Details
Closed on
Dec 8, 2004
Sold by
Cruz Pedro Robles
Bought by
Parra Juan and Parra Hortensia
Home Financials for this Owner
Home Financials are based on the most recent Mortgage that was taken out on this home.
Original Mortgage
$136,000
Interest Rate
5.74%
Mortgage Type
Purchase Money Mortgage
Purchase Details
Closed on
May 25, 1996
Sold by
Cruz Carolina Robles
Bought by
Cruz Pedro Robles
Home Financials for this Owner
Home Financials are based on the most recent Mortgage that was taken out on this home.
Original Mortgage
$84,933
Interest Rate
7.97%
Mortgage Type
FHA
Purchase Details
Closed on
Nov 1, 1995
Sold by
Curl Donald E
Bought by
American Custody Corp and Property Asset Management Inc
Create a Home Valuation Report for This Property
The Home Valuation Report is an in-depth analysis detailing your home's value as well as a comparison with similar homes in the area
Home Values in the Area
Average Home Value in this Area
Purchase History
| Date | Buyer | Sale Price | Title Company |
|---|---|---|---|
| Parra Family Trust | -- | None Listed On Document | |
| Parra Juan | -- | Financial Title Co Sb | |
| Cruz Pedro Robles | -- | Chicago Title Co | |
| Parra Juan | $85,000 | Chicago Title Co | |
| American Custody Corp | $60,000 | Chicago Title Co |
Source: Public Records
Mortgage History
| Date | Status | Borrower | Loan Amount |
|---|---|---|---|
| Previous Owner | Parra Juan | $136,000 | |
| Previous Owner | Parra Juan | $84,933 |
Source: Public Records
Tax History
| Year | Tax Paid | Tax Assessment Tax Assessment Total Assessment is a certain percentage of the fair market value that is determined by local assessors to be the total taxable value of land and additions on the property. | Land | Improvement |
|---|---|---|---|---|
| 2025 | $2,927 | $202,847 | $53,307 | $149,540 |
| 2024 | $2,765 | $198,870 | $52,262 | $146,608 |
| 2023 | $2,248 | $194,970 | $51,237 | $143,733 |
| 2022 | $2,222 | $191,147 | $50,232 | $140,915 |
| 2021 | $2,193 | $187,399 | $49,247 | $138,152 |
| 2020 | $2,572 | $185,477 | $48,742 | $136,735 |
| 2019 | $2,486 | $181,840 | $47,786 | $134,054 |
| 2018 | $2,102 | $178,274 | $46,849 | $131,425 |
| 2017 | $2,055 | $174,778 | $45,930 | $128,848 |
| 2016 | $2,026 | $171,351 | $45,029 | $126,322 |
| 2015 | $2,004 | $168,778 | $44,353 | $124,425 |
| 2014 | $1,962 | $165,472 | $43,484 | $121,988 |
Source: Public Records
Map
Nearby Homes
- 12995 Leith Way
- 35194 Velardo Dr
- 12704 California St
- 35211 Elm Ln
- 12650 California St Unit 72
- 12650 California St Unit 15
- 12941 2nd St Space#63 Unit 63
- 35131 Wildwood Canyon Rd
- 35155 Avenue E
- 12770 Douglas St
- 13060 2nd St Unit 95
- 13060 2nd St Unit 125
- 12700 2nd St Unit 46
- 12779 Douglas St
- 34863 Wildwood Canyon Rd
- 35550 Bella Vista Dr
- 35372 Avenue E
- 12582 2nd St Unit 65
- 12582 2nd St Unit 77
- 12582 2nd St Unit 32
- 35163 Mountain View St
- 35143 Mountain View St
- 35175 Mountain View St
- 35133 Mountain View St
- 35154 Mountain View St
- 35168 Mountain View St
- 35185 Mountain View St
- 35123 Mountain View St
- 35150 Bella Vista Dr
- 35132 Velardo Dr
- 35142 Bella Vista Dr
- 35178 Mountain View St
- 35170 Bella Vista Dr
- 35132 Bella Vista Dr
- 35155 Velardo Dr
- 35195 Mountain View St
- 35111 Mountain View St
- 35136 Velardo Dr
- 35190 Mountain View St
- 35182 Bella Vista Dr
Your Personal Tour Guide
Ask me questions while you tour the home.