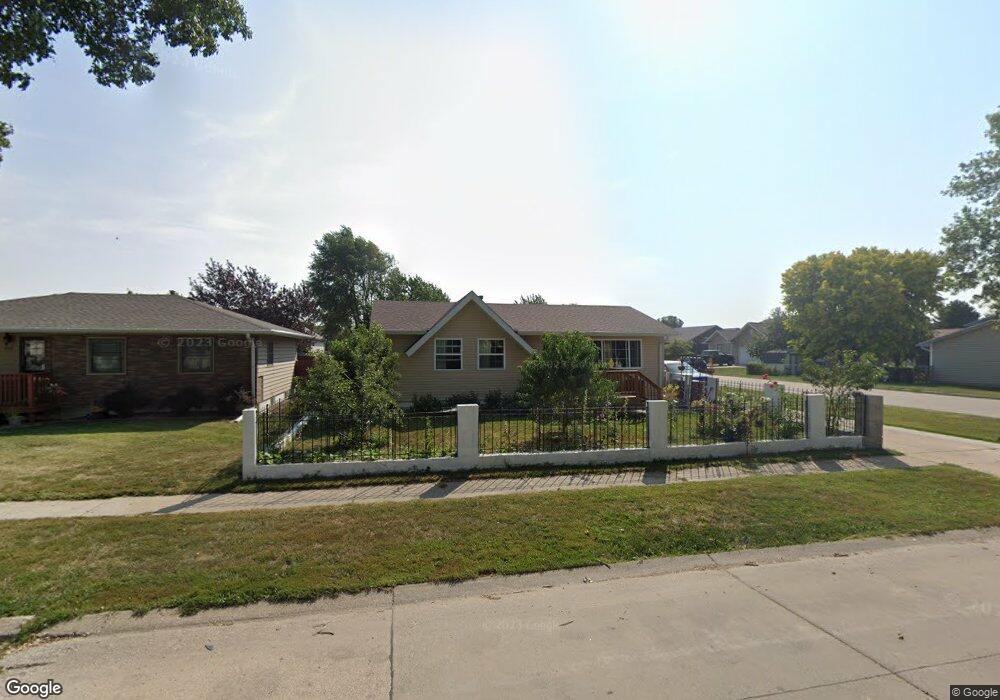
3516 El Dorado Way South Sioux City, NE 68776
Estimated Value: $195,124 - $235,000
3
Beds
2
Baths
912
Sq Ft
$232/Sq Ft
Est. Value
About This Home
This home is located at 3516 El Dorado Way, South Sioux City, NE 68776 and is currently estimated at $211,281, approximately $231 per square foot. 3516 El Dorado Way is a home located in Dakota County with nearby schools including Cardinal Elementary School, South Sioux City Middle School, and South Sioux Senior High School.
Ownership History
Date
Name
Owned For
Owner Type
Purchase Details
Closed on
Jul 11, 2019
Sold by
Ledesma Anacleto and Ledesma Maria H
Bought by
Ledesma Anacleto and Ledesma Maria H
Current Estimated Value
Purchase Details
Closed on
Oct 27, 2015
Sold by
Ledesma Martin M and Ledesma Silvia
Bought by
Ledesma Anacleto and Ledesma Aria H
Home Financials for this Owner
Home Financials are based on the most recent Mortgage that was taken out on this home.
Original Mortgage
$91,000
Outstanding Balance
$54,985
Interest Rate
3.9%
Mortgage Type
New Conventional
Estimated Equity
$156,296
Purchase Details
Closed on
Sep 10, 2009
Sold by
Comeau Janet L and Comeau Jerome C
Bought by
Ledesma Anacleto and Ledesma Maric H
Home Financials for this Owner
Home Financials are based on the most recent Mortgage that was taken out on this home.
Original Mortgage
$98,402
Interest Rate
5.12%
Mortgage Type
FHA
Create a Home Valuation Report for This Property
The Home Valuation Report is an in-depth analysis detailing your home's value as well as a comparison with similar homes in the area
Home Values in the Area
Average Home Value in this Area
Purchase History
| Date | Buyer | Sale Price | Title Company |
|---|---|---|---|
| Ledesma Anacleto | -- | None Available | |
| Ledesma Anacleto | -- | None Available | |
| Ledesma Anacleto | $102,000 | -- |
Source: Public Records
Mortgage History
| Date | Status | Borrower | Loan Amount |
|---|---|---|---|
| Open | Ledesma Anacleto | $91,000 | |
| Closed | Ledesma Anacleto | $98,402 |
Source: Public Records
Tax History Compared to Growth
Tax History
| Year | Tax Paid | Tax Assessment Tax Assessment Total Assessment is a certain percentage of the fair market value that is determined by local assessors to be the total taxable value of land and additions on the property. | Land | Improvement |
|---|---|---|---|---|
| 2024 | $1,893 | $144,925 | $16,215 | $128,710 |
| 2023 | $2,294 | $129,215 | $15,030 | $114,185 |
| 2022 | $1,846 | $96,545 | $15,030 | $81,515 |
| 2021 | $1,767 | $89,135 | $15,030 | $74,105 |
| 2020 | $1,753 | $87,705 | $15,030 | $72,675 |
| 2019 | $1,759 | $87,705 | $15,030 | $72,675 |
| 2018 | $1,718 | $84,975 | $13,800 | $71,175 |
| 2017 | $1,531 | $75,880 | $13,800 | $62,080 |
| 2016 | $1,414 | $71,315 | $13,800 | $57,515 |
| 2014 | $1,455 | $70,680 | $15,300 | $55,380 |
Source: Public Records
Map
Nearby Homes
- 825 Ash St
- 3722 Le Mesa Way
- 3819 Crescent Ln
- 324 Regency Ct
- 300 Kerri Ln
- 605 Stagecoach Rd
- 125 E 30th St
- 214 W 31st St
- 3652 Prairie Grove
- 438 Walnut Ln
- 3430 Walnut Ln
- 3530 Walnut Ln
- 3420 Walnut Ln
- 437 Walnut Ln
- 2101 F St
- 389 Willow Gardens
- 3312 Cedar Mill Way
- 3200 Cider Mill Way
- 1840 Ogden Ct
- 1700 Ogden Ct
- 3512 El Dorado Way
- 3513 Santana Dr
- 3508 El Dorado Way
- 3509 Santana Dr
- 3600 El Dorado Way
- 910 El Paso Dr
- 3504 El Dorado Way
- 3604 El Dorado Way
- 3505 Santana Dr
- 3513 El Dorado Way
- 3509 El Dorado Way
- - Lot 34 35 Santana Dr
- 3505 El Dorado Way
- 828 El Paso Dr
- 914 El Paso Dr
- 3501 El Dorado Way
- 3501 Santana Dr
- 3500 El Dorado Way
- 824 El Paso Dr
- 905 Pine St Unit 909