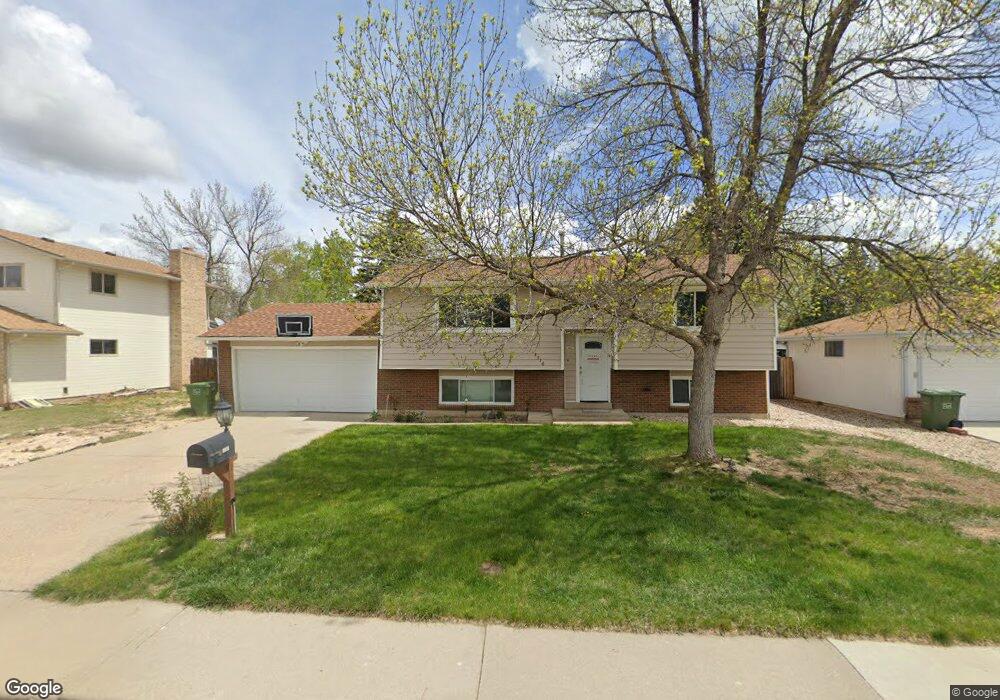
3516 Logan Ave Loveland, CO 80538
Estimated Value: $447,531 - $476,000
4
Beds
2
Baths
1,898
Sq Ft
$244/Sq Ft
Est. Value
About This Home
This home is located at 3516 Logan Ave, Loveland, CO 80538 and is currently estimated at $462,883, approximately $243 per square foot. 3516 Logan Ave is a home located in Larimer County with nearby schools including Lincoln Elementary School, Lucile Erwin Middle School, and Loveland High School.
Ownership History
Date
Name
Owned For
Owner Type
Purchase Details
Closed on
Apr 8, 2021
Sold by
Foth David C and Foth Carol A
Bought by
Foth David C and Foth Shyenne M
Current Estimated Value
Purchase Details
Closed on
May 4, 2017
Sold by
Foth David C
Bought by
Foth David C and Foth Carol A
Home Financials for this Owner
Home Financials are based on the most recent Mortgage that was taken out on this home.
Original Mortgage
$146,500
Outstanding Balance
$122,265
Interest Rate
4.23%
Mortgage Type
New Conventional
Estimated Equity
$340,618
Purchase Details
Closed on
Sep 30, 2004
Sold by
Chadsey David O and Chadsey Linda L
Bought by
Foth David C
Home Financials for this Owner
Home Financials are based on the most recent Mortgage that was taken out on this home.
Original Mortgage
$154,320
Interest Rate
5.81%
Mortgage Type
Purchase Money Mortgage
Purchase Details
Closed on
Jun 1, 1990
Bought by
Chadsey David O and Chadsey Linda L
Create a Home Valuation Report for This Property
The Home Valuation Report is an in-depth analysis detailing your home's value as well as a comparison with similar homes in the area
Home Values in the Area
Average Home Value in this Area
Purchase History
| Date | Buyer | Sale Price | Title Company |
|---|---|---|---|
| Foth David C | -- | None Available | |
| Foth David C | -- | Fidelity National Title | |
| Foth David C | $192,900 | -- | |
| Chadsey David O | $64,500 | -- |
Source: Public Records
Mortgage History
| Date | Status | Borrower | Loan Amount |
|---|---|---|---|
| Open | Foth David C | $146,500 | |
| Closed | Foth David C | $154,320 |
Source: Public Records
Tax History Compared to Growth
Tax History
| Year | Tax Paid | Tax Assessment Tax Assessment Total Assessment is a certain percentage of the fair market value that is determined by local assessors to be the total taxable value of land and additions on the property. | Land | Improvement |
|---|---|---|---|---|
| 2025 | $2,089 | $29,855 | $3,015 | $26,840 |
| 2024 | $2,014 | $29,855 | $3,015 | $26,840 |
| 2022 | $1,858 | $23,346 | $3,128 | $20,218 |
| 2021 | $1,909 | $24,017 | $3,218 | $20,799 |
| 2020 | $1,895 | $23,839 | $3,218 | $20,621 |
| 2019 | $1,863 | $23,839 | $3,218 | $20,621 |
| 2018 | $1,568 | $19,051 | $3,240 | $15,811 |
| 2017 | $1,350 | $19,051 | $3,240 | $15,811 |
| 2016 | $1,228 | $16,748 | $3,582 | $13,166 |
| 2015 | $1,218 | $16,750 | $3,580 | $13,170 |
| 2014 | $1,028 | $13,670 | $3,580 | $10,090 |
Source: Public Records
Map
Nearby Homes
- 717 W 36th St
- 3312 N Colorado Ave
- 3210 N Colorado Ave
- 3321 Butternut Dr
- 3110 N Franklin Ave
- 3638 Butternut Dr Unit 7A
- 3750 Sheridan Ave
- 1221 Bay Ct
- 706 W 29th St
- 367 Limber Place
- 4056 Boxelder Dr
- 4019 Burr Oak Dr
- 2640 Logan Dr
- 3621 Adena Ct
- 1463 Caddoa Dr
- 4105 N Garfield Ave Unit 100
- 4105 N Garfield Ave Unit 61
- 4150 Ebony Ct
- 4403 Shubert Dr
- 2922 Alamosa Ct
- 3512 Logan Ave
- 3520 Logan Ave
- 3515 N Colorado Ave
- 3511 N Colorado Ave
- 3508 Logan Ave
- 3519 N Colorado Ave
- 802 W 36th St
- 801 W 35th St
- 3507 N Colorado Ave
- 3504 Logan Ave
- 806 W 36th St
- 805 W 35th St
- 3503 N Colorado Ave
- 713 W 36th St
- 801 W 36th St
- 709 W 36th St
- 800 W 35th St
- 3518 N Colorado Ave
- 3423 N Colorado Ave
- 3514 N Colorado Ave