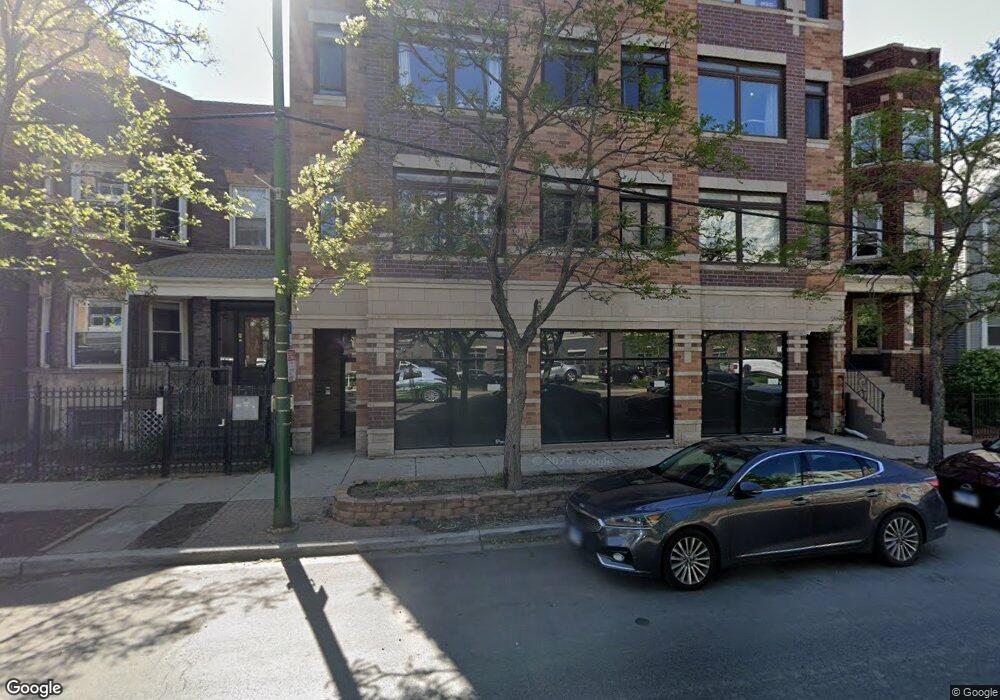
3516 N Ashland Ave Unit G3 Chicago, IL 60657
Southport Corridor NeighborhoodEstimated Value: $514,000 - $579,180
--
Bed
--
Bath
--
Sq Ft
5,489
Sq Ft Lot
About This Home
This home is located at 3516 N Ashland Ave Unit G3, Chicago, IL 60657 and is currently estimated at $544,393. 3516 N Ashland Ave Unit G3 is a home located in Cook County with nearby schools including Hamilton Elementary School, Lake View High School, and Saint Andrew School.
Ownership History
Date
Name
Owned For
Owner Type
Purchase Details
Closed on
Jul 19, 2024
Sold by
Abrons Joshua N and Des Plaines Illinois
Bought by
Zuspan Zachary and Davis Karen
Current Estimated Value
Home Financials for this Owner
Home Financials are based on the most recent Mortgage that was taken out on this home.
Original Mortgage
$380,000
Interest Rate
7.13%
Mortgage Type
New Conventional
Purchase Details
Closed on
Jun 20, 2017
Sold by
Watson Eric and Feuer Susan
Bought by
Abrons Joshua N
Purchase Details
Closed on
Feb 11, 2014
Sold by
Duggan Andrew P
Bought by
Feuer Susan and Watson Eric
Purchase Details
Closed on
Mar 29, 2013
Sold by
Mb829 Llc
Bought by
Duggan Andrew P
Home Financials for this Owner
Home Financials are based on the most recent Mortgage that was taken out on this home.
Original Mortgage
$324,900
Interest Rate
3.46%
Mortgage Type
New Conventional
Purchase Details
Closed on
Sep 26, 2011
Sold by
Chicago Title & Trust Company
Bought by
Mb829 Llc
Create a Home Valuation Report for This Property
The Home Valuation Report is an in-depth analysis detailing your home's value as well as a comparison with similar homes in the area
Home Values in the Area
Average Home Value in this Area
Purchase History
| Date | Buyer | Sale Price | Title Company |
|---|---|---|---|
| Zuspan Zachary | $475,000 | Proper Title | |
| Zuspan Zachary | $475,000 | Proper Title | |
| Abrons Joshua N | $410,500 | Prairie Title | |
| Feuer Susan | $179,000 | None Available | |
| Duggan Andrew P | $342,000 | None Available | |
| Mb829 Llc | -- | None Available |
Source: Public Records
Mortgage History
| Date | Status | Borrower | Loan Amount |
|---|---|---|---|
| Previous Owner | Zuspan Zachary | $380,000 | |
| Previous Owner | Duggan Andrew P | $324,900 |
Source: Public Records
Tax History Compared to Growth
Tax History
| Year | Tax Paid | Tax Assessment Tax Assessment Total Assessment is a certain percentage of the fair market value that is determined by local assessors to be the total taxable value of land and additions on the property. | Land | Improvement |
|---|---|---|---|---|
| 2024 | $177 | $4,939 | $1,181 | $3,758 |
| 2023 | $172 | $816 | $500 | $316 |
| 2022 | $172 | $816 | $500 | $316 |
| 2021 | $168 | $814 | $499 | $315 |
| 2020 | $814 | $3,558 | $426 | $3,132 |
| 2019 | $802 | $3,879 | $426 | $3,453 |
| 2018 | $788 | $3,879 | $426 | $3,453 |
| 2017 | $887 | $4,002 | $380 | $3,622 |
| 2016 | $826 | $4,002 | $380 | $3,622 |
| 2015 | $758 | $4,002 | $380 | $3,622 |
| 2014 | $725 | $3,774 | $310 | $3,464 |
| 2013 | $712 | $3,774 | $310 | $3,464 |
Source: Public Records
Map
Nearby Homes
- 3448 N Ashland Ave Unit 2S
- 3438 N Ashland Ave Unit 2N
- 3507 N Bosworth Ave
- 3422 N Bosworth Ave Unit 1
- 3644 N Bosworth Ave
- 1753 W Cornelia Ave
- 3509 N Janssen Ave
- 3639 N Greenview Ave
- 1743 W Newport Ave
- 3621 N Ravenswood Ave
- 1447 W Roscoe St Unit PH
- 1447 W Roscoe St Unit 1
- 1541 W Henderson St Unit D
- 3434 N Southport Ave Unit 2
- 1807 W Addison St Unit 2W
- 3719 N Bosworth Ave
- 3539 N Southport Ave Unit 2N
- 1645 W School St Unit 418
- 3749 N Ashland Ave Unit 3S
- 1833 W Addison St Unit 2
- 3516 N Ashland Ave Unit G7
- 3516 N Ashland Ave Unit G6
- 3516 N Ashland Ave Unit G5
- 3516 N Ashland Ave Unit G4
- 3516 N Ashland Ave Unit G2
- 3516 N Ashland Ave Unit G1
- 3516 N Ashland Ave Unit 4S
- 3516 N Ashland Ave Unit 4N
- 3516 N Ashland Ave Unit 3N
- 3516 N Ashland Ave Unit 2S
- 3516 N Ashland Ave Unit 2N
- 3516 N Ashland Ave Unit C
- 3514 N Ashland Ave
- 3514 N Ashland Ave
- 3520 N Ashland Ave Unit 3N
- 3520 N Ashland Ave Unit 2N
- 3522 N Ashland Ave
- 3512 N Ashland Ave
- 3524 N Ashland Ave
- 3510 N Ashland Ave