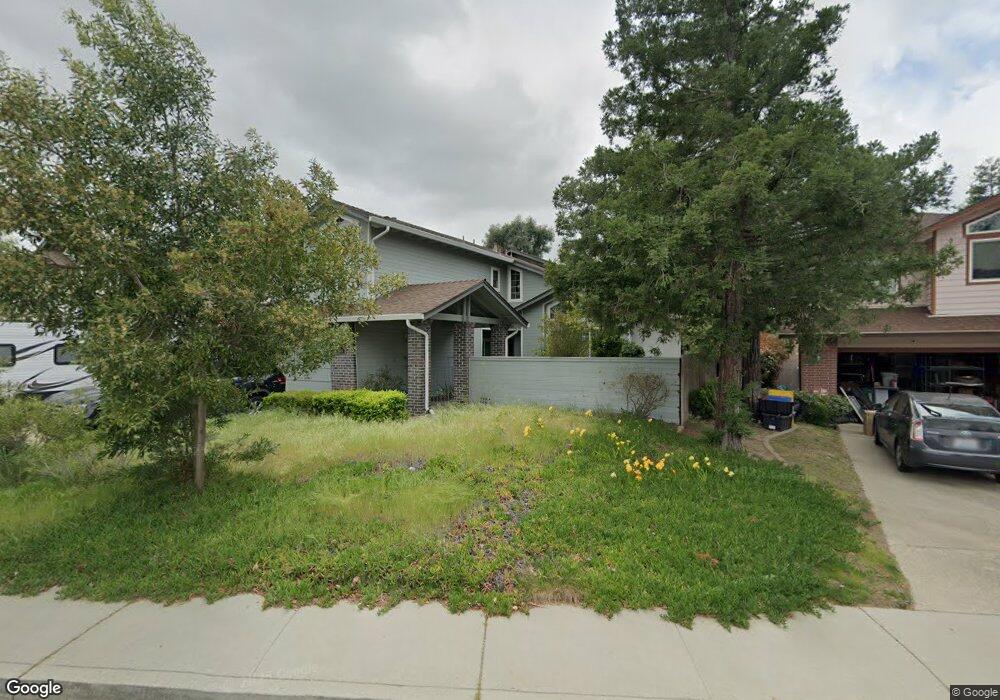
3516 Tabora Dr Antioch, CA 94509
Contra Loma NeighborhoodEstimated Value: $635,000 - $687,000
4
Beds
3
Baths
2,490
Sq Ft
$265/Sq Ft
Est. Value
About This Home
This home is located at 3516 Tabora Dr, Antioch, CA 94509 and is currently estimated at $660,548, approximately $265 per square foot. 3516 Tabora Dr is a home located in Contra Costa County with nearby schools including Sutter Elementary School, Park Middle School, and Antioch High School.
Ownership History
Date
Name
Owned For
Owner Type
Purchase Details
Closed on
Jul 6, 2015
Sold by
Hsiang Fu Li
Bought by
Hu Anthony and Hu Jeannie Song
Current Estimated Value
Purchase Details
Closed on
May 12, 2015
Sold by
Tung Chin Lien
Bought by
Hsiang Fu Li
Purchase Details
Closed on
Feb 8, 2012
Sold by
Azimi Mohamed
Bought by
Hsiang Fu Li
Purchase Details
Closed on
Feb 12, 2007
Sold by
Thurlow Fountain A and Thurlow Joan F
Bought by
Azimi Mohammad H
Home Financials for this Owner
Home Financials are based on the most recent Mortgage that was taken out on this home.
Original Mortgage
$430,400
Interest Rate
6.12%
Mortgage Type
Purchase Money Mortgage
Purchase Details
Closed on
Dec 27, 1998
Sold by
Fagerstrom and Bernice
Bought by
Thurlow Fountain A and Thurlow Joan F
Home Financials for this Owner
Home Financials are based on the most recent Mortgage that was taken out on this home.
Original Mortgage
$192,750
Interest Rate
6.82%
Mortgage Type
Purchase Money Mortgage
Create a Home Valuation Report for This Property
The Home Valuation Report is an in-depth analysis detailing your home's value as well as a comparison with similar homes in the area
Home Values in the Area
Average Home Value in this Area
Purchase History
| Date | Buyer | Sale Price | Title Company |
|---|---|---|---|
| Hu Anthony | $371,000 | First American Title Company | |
| Hsiang Fu Li | -- | First American Title Company | |
| Hsiang Fu Li | $249,000 | First American Title Company | |
| Azimi Mohammad H | $538,000 | Old Republic Title Company | |
| Thurlow Fountain A | $257,000 | Old Republic Title Company |
Source: Public Records
Mortgage History
| Date | Status | Borrower | Loan Amount |
|---|---|---|---|
| Previous Owner | Azimi Mohammad H | $430,400 | |
| Previous Owner | Thurlow Fountain A | $192,750 |
Source: Public Records
Tax History Compared to Growth
Tax History
| Year | Tax Paid | Tax Assessment Tax Assessment Total Assessment is a certain percentage of the fair market value that is determined by local assessors to be the total taxable value of land and additions on the property. | Land | Improvement |
|---|---|---|---|---|
| 2025 | $5,485 | $439,181 | $109,201 | $329,980 |
| 2024 | $5,216 | $430,570 | $107,060 | $323,510 |
| 2023 | $5,216 | $422,128 | $104,961 | $317,167 |
| 2022 | $5,135 | $413,852 | $102,903 | $310,949 |
| 2021 | $4,933 | $405,738 | $100,886 | $304,852 |
| 2019 | $4,883 | $393,706 | $97,895 | $295,811 |
| 2018 | $4,712 | $385,987 | $95,976 | $290,011 |
| 2017 | $4,597 | $378,420 | $94,095 | $284,325 |
| 2016 | $4,501 | $371,000 | $92,250 | $278,750 |
| 2015 | $3,284 | $260,229 | $57,846 | $202,383 |
| 2014 | $3,188 | $255,132 | $56,713 | $198,419 |
Source: Public Records
Map
Nearby Homes
- 3203 Pierce Ct
- 3207 Tabora Dr
- 3366 S Francisco Way
- 1205 Putnam St
- 3401 Longview Rd
- 3163 S Francisco Way
- 2208 Hamlin Dr
- 2205 Robles Dr
- 30 Greensboro Way
- 2225 Sherman Ct
- 5 Terranova Dr
- 4109 S Royal Links Cir
- 3126 Lone Tree Way
- 1016 San Carlos Dr
- 2744 El Rey St
- 18 Danridge Ct
- 2924 N Francisco Way
- 401 San Joaquin Ave
- 312 Putnam St
- 2744 Capistrano St
- 3520 Tabora Dr
- 3512 Tabora Dr
- 3524 Tabora Dr
- 3501 Davi Place
- 3505 Davi Place
- 3511 Davi Ct
- 3528 Tabora Dr
- 3509 Davi Place
- 3506 Davi Ct
- 3516 Dameron Place
- 3514 Dameron Place
- 3518 Dameron Place
- 3512 Dameron Place
- 3520 Dameron Place
- 3515 Davi Ct
- 3522 Dameron Place
- 3513 Davi Place
- 3501 Dameron Place
- 3505 Tabora Dr
- 3512 Davi Ct