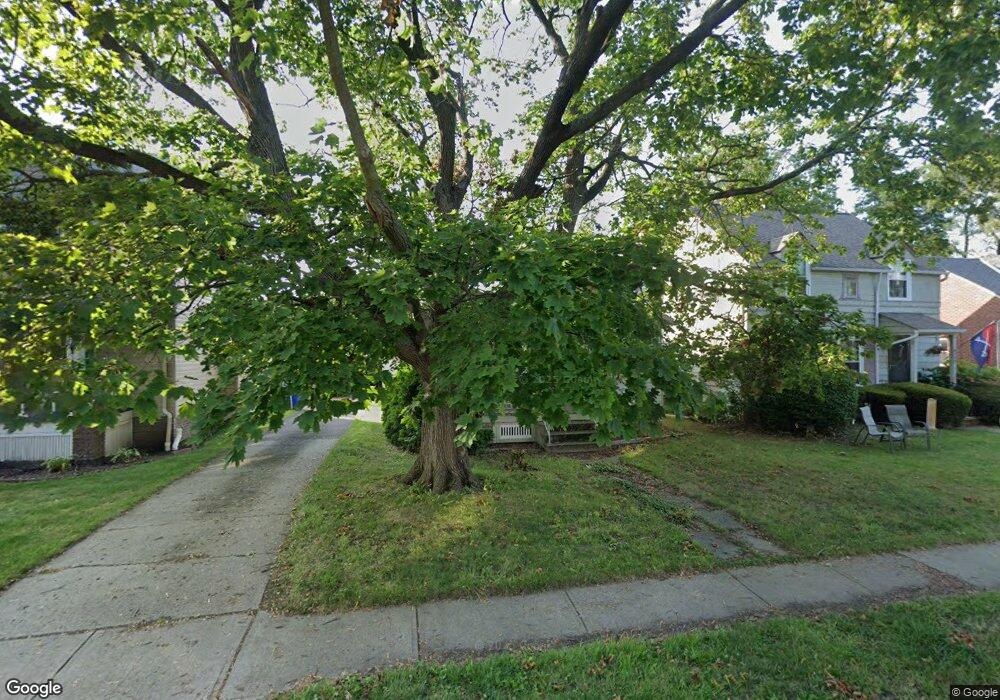
3516 Tuttle Ave Cleveland, OH 44111
Kamm's Corners NeighborhoodEstimated Value: $169,674 - $209,000
2
Beds
1
Bath
779
Sq Ft
$242/Sq Ft
Est. Value
About This Home
This home is located at 3516 Tuttle Ave, Cleveland, OH 44111 and is currently estimated at $188,169, approximately $241 per square foot. 3516 Tuttle Ave is a home located in Cuyahoga County with nearby schools including Orchard Park Academy, Constellation Schools: Westpark Community, and Our Lady of Angels School.
Ownership History
Date
Name
Owned For
Owner Type
Purchase Details
Closed on
Aug 21, 2002
Sold by
Bancroft Jeffrey P
Bought by
Bancroft Charles R
Current Estimated Value
Home Financials for this Owner
Home Financials are based on the most recent Mortgage that was taken out on this home.
Original Mortgage
$90,200
Outstanding Balance
$36,537
Interest Rate
6.63%
Estimated Equity
$151,632
Purchase Details
Closed on
Jan 2, 1998
Sold by
Bonacci Margherita
Bought by
Bancroft Jeffrey P
Purchase Details
Closed on
Aug 19, 1992
Sold by
Smetana Stella
Bought by
Bancroft Jeffrey P
Purchase Details
Closed on
Jan 6, 1992
Sold by
Zawalny Jon
Bought by
Smetana Stella
Purchase Details
Closed on
Sep 26, 1990
Sold by
Newton Robert E
Bought by
Zawalny Jon
Purchase Details
Closed on
Jul 23, 1986
Sold by
Keller Thomas J
Bought by
Newton Robert E
Purchase Details
Closed on
Mar 4, 1985
Sold by
Keller Thomas J and Keller Anna
Bought by
Keller Thomas J
Purchase Details
Closed on
Jan 1, 1975
Bought by
Keller Thomas J and Keller Anna
Create a Home Valuation Report for This Property
The Home Valuation Report is an in-depth analysis detailing your home's value as well as a comparison with similar homes in the area
Home Values in the Area
Average Home Value in this Area
Purchase History
| Date | Buyer | Sale Price | Title Company |
|---|---|---|---|
| Bancroft Charles R | $110,000 | Real Living Title Agency Ltd | |
| Bancroft Jeffrey P | -- | -- | |
| Bancroft Jeffrey P | $59,900 | -- | |
| Smetana Stella | -- | -- | |
| Zawalny Jon | $56,000 | -- | |
| Newton Robert E | $29,000 | -- | |
| Keller Thomas J | -- | -- | |
| Keller Thomas J | -- | -- |
Source: Public Records
Mortgage History
| Date | Status | Borrower | Loan Amount |
|---|---|---|---|
| Open | Bancroft Charles R | $90,200 |
Source: Public Records
Tax History
| Year | Tax Paid | Tax Assessment Tax Assessment Total Assessment is a certain percentage of the fair market value that is determined by local assessors to be the total taxable value of land and additions on the property. | Land | Improvement |
|---|---|---|---|---|
| 2025 | $2,548 | $49,000 | $14,000 | $35,000 |
| 2024 | $2,570 | $49,000 | $14,000 | $35,000 |
| 2023 | $2,693 | $35,500 | $11,100 | $24,400 |
| 2022 | $2,677 | $35,490 | $11,100 | $24,400 |
| 2021 | $2,650 | $35,490 | $11,100 | $24,400 |
| 2020 | $2,358 | $27,300 | $8,540 | $18,760 |
| 2019 | $2,180 | $78,000 | $24,400 | $53,600 |
| 2018 | $2,193 | $27,300 | $8,540 | $18,760 |
| 2017 | $2,231 | $27,060 | $7,210 | $19,850 |
| 2016 | $2,214 | $27,060 | $7,210 | $19,850 |
| 2015 | $2,021 | $27,060 | $7,210 | $19,850 |
| 2014 | $2,021 | $24,610 | $6,550 | $18,060 |
Source: Public Records
Map
Nearby Homes
- 15616 Greenway Rd
- 3464 Tuttle Ave
- 16305 Marquis Ave
- 3605 Warren Rd
- 3337 W 162nd St
- 3334 W 155th St
- 15235 Lorain Ave
- 15801 Edgecliff Ave
- 3851 W 157th St
- 3298 W 165th St
- 3682 Rocky River Dr
- 14732 Grapeland Ave
- 14606 Rainbow Ave
- 3879 W 157th St
- 32743 Warren Rd Unit 19
- 32742 Warren Rd Unit 18
- 32741 Warren Rd Unit 17
- 15719 Montrose Ave
- 17512 Allien Ave
- 3154 W 162nd St
- 3512 Tuttle Ave
- 3520 Tuttle Ave
- 3508 Tuttle Ave
- 3524 Tuttle Ave
- 3517 Granton Ave
- 3529 Granton Ave
- 3511 Granton Ave
- 3528 Tuttle Ave
- 3504 Tuttle Ave
- 3531 Granton Ave
- 3505 Granton Ave
- 3517 Tuttle Ave
- 3513 Tuttle Ave
- 3533 Granton Ave
- 3499 Granton Ave
- 3509 Tuttle Ave
- 3500 Tuttle Ave
- 3532 Tuttle Ave
- 3525 Tuttle Ave
- 3505 Tuttle Ave
Your Personal Tour Guide
Ask me questions while you tour the home.