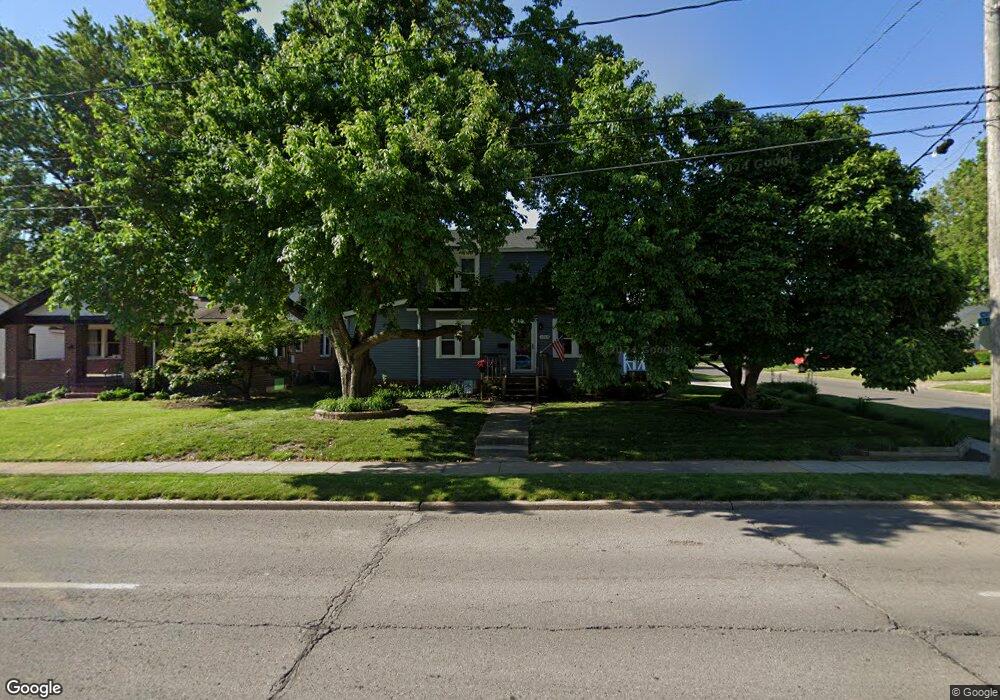
3518 Hickman Rd Des Moines, IA 50310
Beaverdale NeighborhoodEstimated Value: $258,248 - $285,000
4
Beds
2
Baths
1,408
Sq Ft
$192/Sq Ft
Est. Value
About This Home
This home is located at 3518 Hickman Rd, Des Moines, IA 50310 and is currently estimated at $269,812, approximately $191 per square foot. 3518 Hickman Rd is a home located in Polk County with nearby schools including Monroe Elementary School, Meredith Middle School, and Hoover High School.
Ownership History
Date
Name
Owned For
Owner Type
Purchase Details
Closed on
Jul 11, 2023
Sold by
Bartleman Larry G and Bartleman Susan M
Bought by
Bartleman Larry G and Bartleman Susan M
Current Estimated Value
Purchase Details
Closed on
Mar 11, 2003
Sold by
Bartleman Susan M and Wilson Susan M
Bought by
Bartleman Larry and Bartleman Susan M
Create a Home Valuation Report for This Property
The Home Valuation Report is an in-depth analysis detailing your home's value as well as a comparison with similar homes in the area
Home Values in the Area
Average Home Value in this Area
Purchase History
| Date | Buyer | Sale Price | Title Company |
|---|---|---|---|
| Bartleman Larry G | -- | None Listed On Document | |
| Bartleman Larry | -- | -- |
Source: Public Records
Tax History Compared to Growth
Tax History
| Year | Tax Paid | Tax Assessment Tax Assessment Total Assessment is a certain percentage of the fair market value that is determined by local assessors to be the total taxable value of land and additions on the property. | Land | Improvement |
|---|---|---|---|---|
| 2025 | $3,696 | $235,800 | $45,800 | $190,000 |
| 2024 | $3,696 | $214,000 | $41,500 | $172,500 |
| 2023 | $3,956 | $214,000 | $41,500 | $172,500 |
| 2022 | $3,922 | $180,100 | $35,900 | $144,200 |
| 2021 | $3,782 | $180,100 | $35,900 | $144,200 |
| 2020 | $3,920 | $163,400 | $32,800 | $130,600 |
| 2019 | $3,562 | $163,400 | $32,800 | $130,600 |
| 2018 | $3,518 | $144,300 | $28,700 | $115,600 |
| 2017 | $3,182 | $144,300 | $28,700 | $115,600 |
| 2016 | $3,092 | $129,400 | $25,600 | $103,800 |
| 2015 | $3,092 | $129,400 | $25,600 | $103,800 |
| 2014 | $3,118 | $129,400 | $25,100 | $104,300 |
Source: Public Records
Map
Nearby Homes