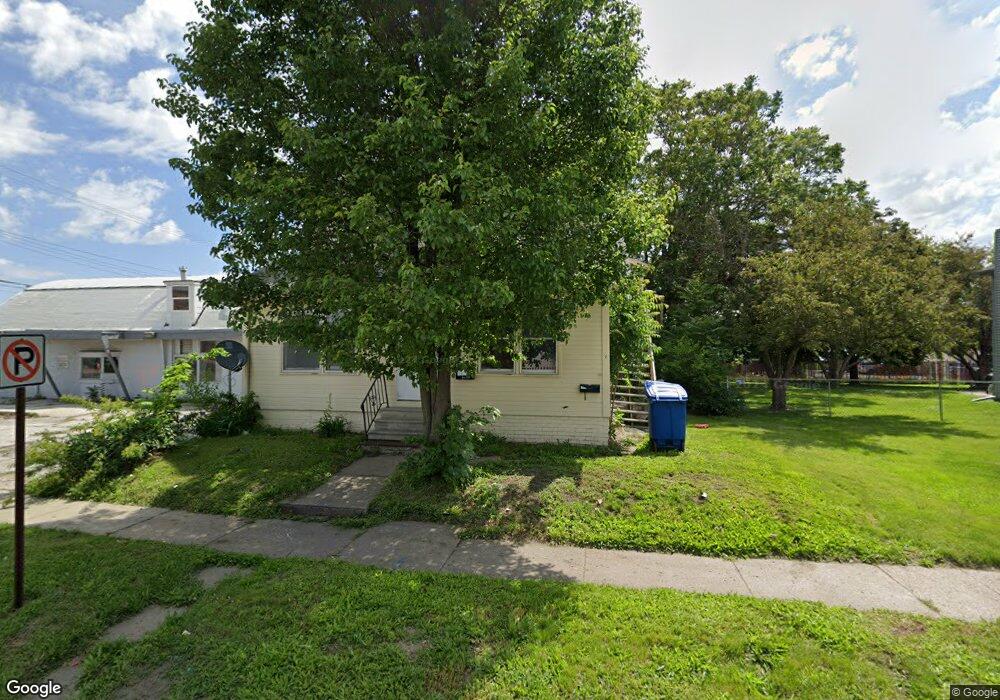
3519 3rd St Des Moines, IA 50313
Highland Park NeighborhoodEstimated Value: $141,810 - $161,000
Studio
3
Baths
1,744
Sq Ft
$87/Sq Ft
Est. Value
About This Home
This home is located at 3519 3rd St, Des Moines, IA 50313 and is currently estimated at $151,405, approximately $86 per square foot. 3519 3rd St is a home located in Polk County with nearby schools including Oak Park Elementary School, Harding Middle School, and North High School.
Ownership History
Date
Name
Owned For
Owner Type
Purchase Details
Closed on
Jul 17, 2021
Sold by
Wang Hui and Fang Yang
Bought by
Fifty Five Thirty Three Llc
Current Estimated Value
Purchase Details
Closed on
Aug 30, 2017
Sold by
Agan Linda A and Estate Of Carl D Baker
Bought by
Wang Hui
Home Financials for this Owner
Home Financials are based on the most recent Mortgage that was taken out on this home.
Original Mortgage
$58,500
Interest Rate
3.93%
Purchase Details
Closed on
Feb 23, 2017
Sold by
Agan Linda A and Baker Joyce A
Bought by
Agan Linda A
Create a Home Valuation Report for This Property
The Home Valuation Report is an in-depth analysis detailing your home's value as well as a comparison with similar homes in the area
Home Values in the Area
Average Home Value in this Area
Purchase History
| Date | Buyer | Sale Price | Title Company |
|---|---|---|---|
| Fifty Five Thirty Three Llc | $115,000 | None Available | |
| Wang Hui | -- | None Available | |
| Agan Linda A | -- | None Available |
Source: Public Records
Mortgage History
| Date | Status | Borrower | Loan Amount |
|---|---|---|---|
| Previous Owner | Wang Hui | $58,500 |
Source: Public Records
Tax History
| Year | Tax Paid | Tax Assessment Tax Assessment Total Assessment is a certain percentage of the fair market value that is determined by local assessors to be the total taxable value of land and additions on the property. | Land | Improvement |
|---|---|---|---|---|
| 2025 | $2,536 | $148,000 | $19,700 | $128,300 |
| 2024 | $2,536 | $128,900 | $17,100 | $111,800 |
| 2023 | $2,446 | $128,900 | $17,100 | $111,800 |
| 2022 | $2,428 | $103,800 | $14,500 | $89,300 |
| 2021 | $2,284 | $103,800 | $14,500 | $89,300 |
| 2020 | $2,372 | $91,500 | $12,900 | $78,600 |
| 2019 | $2,268 | $91,500 | $12,900 | $78,600 |
| 2018 | $2,246 | $84,400 | $11,800 | $72,600 |
| 2017 | $2,056 | $84,400 | $11,800 | $72,600 |
| 2016 | $2,002 | $76,000 | $10,600 | $65,400 |
| 2015 | $2,002 | $76,000 | $10,600 | $65,400 |
| 2014 | $1,844 | $72,000 | $9,900 | $62,100 |
Source: Public Records
Map
Nearby Homes
Your Personal Tour Guide
Ask me questions while you tour the home.