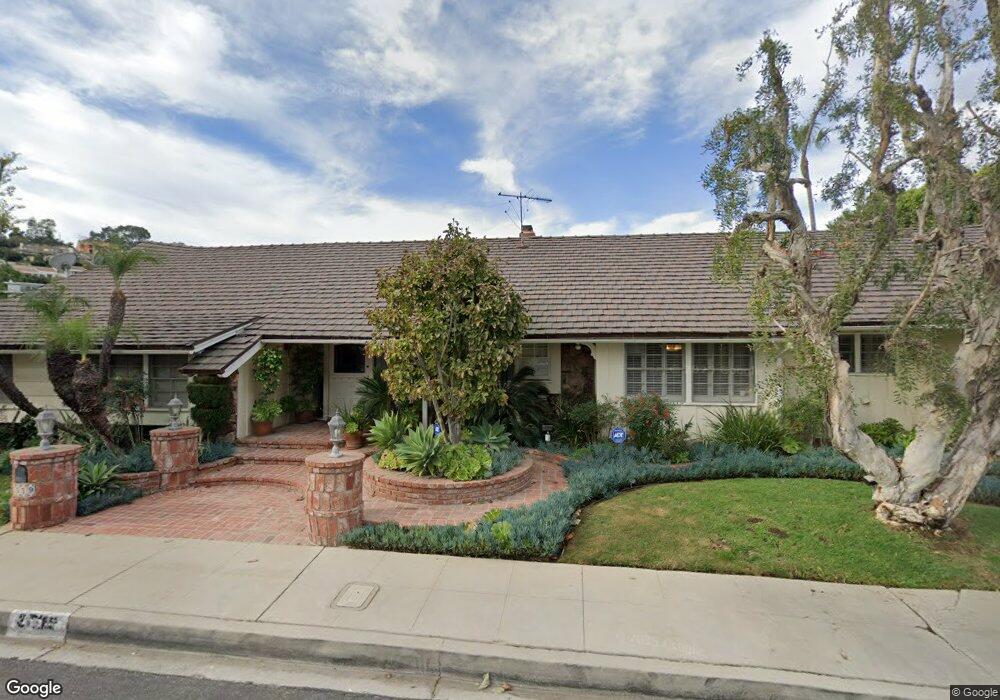
3519 Crownridge Dr Sherman Oaks, CA 91403
Estimated Value: $2,214,398 - $2,573,000
5
Beds
3
Baths
3,255
Sq Ft
$748/Sq Ft
Est. Value
About This Home
This home is located at 3519 Crownridge Dr, Sherman Oaks, CA 91403 and is currently estimated at $2,435,850, approximately $748 per square foot. 3519 Crownridge Dr is a home located in Los Angeles County with nearby schools including Van Nuys High School, Ivy Bound Academy of Math Sci and Tech Charter Middle, and Sherman Oaks Elementary Charter School.
Ownership History
Date
Name
Owned For
Owner Type
Purchase Details
Closed on
Sep 21, 2005
Sold by
Darnov Sharon Elaine
Bought by
Darnov Sharon and Sharon Darnov Family Trust
Current Estimated Value
Purchase Details
Closed on
Sep 20, 2005
Sold by
Darnov Allen Mark and Morris Darnov Qualified Person
Bought by
Darnov Allen Mark and Darnov Sharon Elaine
Purchase Details
Closed on
Aug 25, 1998
Sold by
Darnov Natalie
Bought by
Darnov Allen Mark and Natalie Darnov Qualified Perso
Purchase Details
Closed on
Mar 14, 1994
Sold by
Darnov Morris and Darnov Natalie
Bought by
Darnov Morris and Darnov Natalie
Home Financials for this Owner
Home Financials are based on the most recent Mortgage that was taken out on this home.
Original Mortgage
$150,000
Interest Rate
7.15%
Create a Home Valuation Report for This Property
The Home Valuation Report is an in-depth analysis detailing your home's value as well as a comparison with similar homes in the area
Home Values in the Area
Average Home Value in this Area
Purchase History
| Date | Buyer | Sale Price | Title Company |
|---|---|---|---|
| Darnov Sharon | -- | -- | |
| Darnov Allen Mark | -- | -- | |
| Darnov Allen Mark | -- | -- | |
| Darnov Allen Mark | -- | -- | |
| Darnov Allen Mark | -- | -- | |
| Darnov Morris | -- | -- | |
| Darnov Morris | -- | -- | |
| Darnov Morris | -- | -- | |
| Darnov Morris | -- | Old Republic Title Company |
Source: Public Records
Mortgage History
| Date | Status | Borrower | Loan Amount |
|---|---|---|---|
| Previous Owner | Darnov Morris | $150,000 |
Source: Public Records
Tax History Compared to Growth
Tax History
| Year | Tax Paid | Tax Assessment Tax Assessment Total Assessment is a certain percentage of the fair market value that is determined by local assessors to be the total taxable value of land and additions on the property. | Land | Improvement |
|---|---|---|---|---|
| 2025 | $10,765 | $881,547 | $435,416 | $446,131 |
| 2024 | $10,765 | $864,263 | $426,879 | $437,384 |
| 2023 | $10,559 | $847,317 | $418,509 | $428,808 |
| 2022 | $10,092 | $830,703 | $410,303 | $420,400 |
| 2021 | $9,955 | $814,415 | $402,258 | $412,157 |
| 2019 | $9,659 | $790,261 | $390,328 | $399,933 |
| 2018 | $9,528 | $774,767 | $382,675 | $392,092 |
| 2016 | $9,070 | $744,683 | $367,816 | $376,867 |
| 2015 | $8,938 | $733,499 | $362,292 | $371,207 |
| 2014 | $8,970 | $719,132 | $355,196 | $363,936 |
Source: Public Records
Map
Nearby Homes
- 3530 Royal Woods Dr
- 15656 Crownridge Place
- 3690 Crownridge Dr
- 3634 Royal Meadow Rd
- 3421 Castlewoods Place
- 15508 Royal Ridge Rd
- 3535 Vista Haven Rd
- 15946 Tobin Way
- 3539 Alana Dr
- 3545 Alana Dr
- 3847 Royal Woods Dr
- 3873 Royal Woods Dr
- 3721 Woodcliff Rd
- 15401 Mulholland Dr
- 15511 Woodcrest Dr
- 3585 Alana Dr
- 3935 Valley Meadow Rd
- 16187 Royal Oak Rd
- 3860 Kingswood Rd
- 15415 Milldale Dr
- 3511 Crownridge Dr
- 3531 Crownridge Dr
- 3522 Crownridge Dr
- 3512 Crownridge Dr
- 3500 Valley Meadow Rd
- 3460 Valley Meadow Rd
- 3501 Crownridge Dr
- 3543 Crownridge Dr
- 3501 Royal Woods Dr
- 3536 Crownridge Dr
- 3480 Valley Meadow Rd
- 3515 Royal Woods Dr
- 3531 Royal Woods Dr
- 3517 Valley Meadow Rd
- 3553 Crownridge Dr
- 3541 Royal Woods Dr
- 3546 Crownridge Dr
- 3451 Valley Meadow Rd
- 3530 Valley Meadow Rd
- 3500 Royal Woods Dr