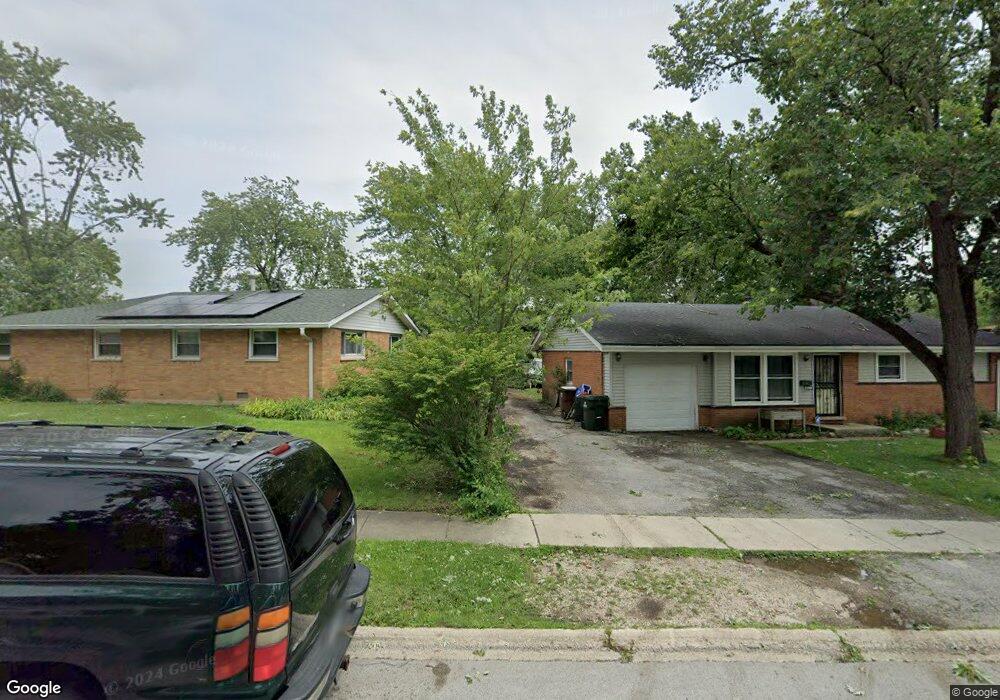
3519 Maple Ln Hazel Crest, IL 60429
Estimated Value: $177,000 - $295,000
3
Beds
2
Baths
1,224
Sq Ft
$179/Sq Ft
Est. Value
About This Home
This home is located at 3519 Maple Ln, Hazel Crest, IL 60429 and is currently estimated at $218,506, approximately $178 per square foot. 3519 Maple Ln is a home located in Cook County with nearby schools including Highlands Elementary School, Prairie-Hills Junior High School, and Hillcrest High School.
Ownership History
Date
Name
Owned For
Owner Type
Purchase Details
Closed on
Apr 4, 2018
Sold by
Lawrence Darrin G
Bought by
Cerberus Sfr Holdings L P
Current Estimated Value
Purchase Details
Closed on
Apr 10, 2003
Sold by
Williams Niena V
Bought by
Lawrence Darrin G
Home Financials for this Owner
Home Financials are based on the most recent Mortgage that was taken out on this home.
Original Mortgage
$105,730
Interest Rate
5.86%
Mortgage Type
Purchase Money Mortgage
Purchase Details
Closed on
Apr 4, 2000
Sold by
Hill Patricia and Dunlap Patricia M
Bought by
Williams Niena V
Home Financials for this Owner
Home Financials are based on the most recent Mortgage that was taken out on this home.
Original Mortgage
$91,350
Interest Rate
8.29%
Mortgage Type
FHA
Purchase Details
Closed on
Jul 11, 1996
Sold by
Dunlap Lawrence
Bought by
Dunlap Patricia M
Create a Home Valuation Report for This Property
The Home Valuation Report is an in-depth analysis detailing your home's value as well as a comparison with similar homes in the area
Home Values in the Area
Average Home Value in this Area
Purchase History
| Date | Buyer | Sale Price | Title Company |
|---|---|---|---|
| Cerberus Sfr Holdings L P | $81,500 | None Available | |
| Lawrence Darrin G | $109,000 | 1St American Title | |
| Lawrence Darrin G | $109,000 | 1St American Title | |
| Williams Niena V | $96,000 | -- | |
| Dunlap Patricia M | -- | -- |
Source: Public Records
Mortgage History
| Date | Status | Borrower | Loan Amount |
|---|---|---|---|
| Previous Owner | Lawrence Darrin G | $105,730 | |
| Previous Owner | Williams Niena V | $91,350 | |
| Closed | Williams Niena V | $4,567 |
Source: Public Records
Tax History
| Year | Tax Paid | Tax Assessment Tax Assessment Total Assessment is a certain percentage of the fair market value that is determined by local assessors to be the total taxable value of land and additions on the property. | Land | Improvement |
|---|---|---|---|---|
| 2025 | $9,009 | $17,586 | $2,922 | $14,664 |
| 2024 | $9,009 | $17,586 | $2,922 | $14,664 |
| 2023 | $5,886 | $17,586 | $2,922 | $14,664 |
| 2022 | $5,886 | $11,439 | $2,473 | $8,966 |
| 2021 | $5,737 | $11,438 | $2,472 | $8,966 |
| 2020 | $5,600 | $11,438 | $2,472 | $8,966 |
| 2019 | $3,651 | $8,882 | $2,248 | $6,634 |
| 2018 | $3,534 | $8,882 | $2,248 | $6,634 |
| 2017 | $4,066 | $10,083 | $2,248 | $7,835 |
| 2016 | $3,900 | $9,167 | $2,023 | $7,144 |
| 2015 | $3,665 | $9,167 | $2,023 | $7,144 |
| 2014 | $3,605 | $9,167 | $2,023 | $7,144 |
| 2013 | $3,735 | $10,428 | $2,023 | $8,405 |
Source: Public Records
Map
Nearby Homes
- 17206 Elm Dr
- 3511 Laurel Ln
- 17113 Elm Dr
- 17213 Springtide Ln
- 17316 Central Park Ave
- 3321 173rd St
- 3311 Hickory Ln
- 17306 Burr Oak Ln
- 3312 Maple Ln
- 17303 Appletree Dr
- 3213 Woodworth Place
- 17007 Elm Dr
- 3318 Tulip Dr
- 3509 Birchwood Dr
- 3806 172nd St
- 3425 Birchwood Dr
- 17000 Magnolia Dr
- 3316 Birchwood Dr
- 17417 Kedzie Ave
- 17640 Central Park Ave
- 3517 Maple Ln
- 3523 Maple Ln
- 3521 Maple Ln
- 3500 Woodworth Place
- 3502 Woodworth Place
- 3430 Woodworth Place
- 3428 Woodworth Place
- 3504 Woodworth Place
- 3515 Maple Ln
- 3426 Woodworth Place
- 3511 Maple Ln
- 3513 Maple Ln
- 17208 Elm Dr
- 3520 Maple Ln
- 3509 Maple Ln
- 17210 Elm Dr
- 3522 Maple Ln
- 3524 Maple Ln
- 17204 Elm Dr
- 3508 Woodworth Place
Your Personal Tour Guide
Ask me questions while you tour the home.