Estimated Value: $773,887 - $940,000
3
Beds
2
Baths
1,410
Sq Ft
$603/Sq Ft
Est. Value
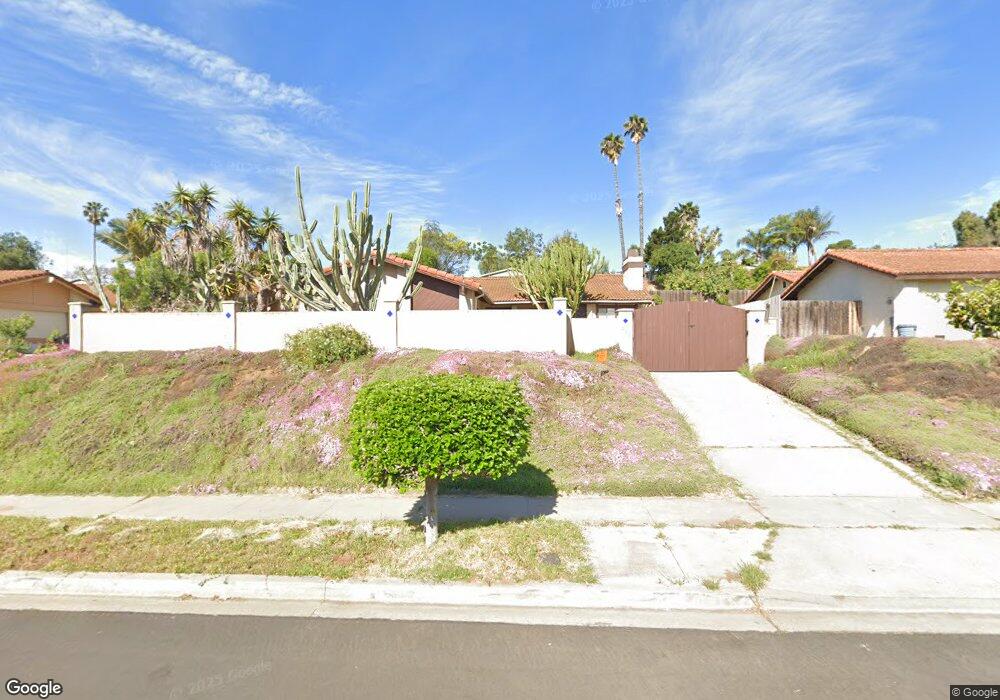
About This Home
This home is located at 352 Anns Way, Vista, CA 92083 and is currently estimated at $850,722, approximately $603 per square foot. 352 Anns Way is a home located in San Diego County with nearby schools including Grapevine Elementary School, Madison Middle School, and Rancho Buena Vista High School.
Ownership History
Date
Name
Owned For
Owner Type
Purchase Details
Closed on
Apr 15, 1998
Sold by
Hud
Bought by
Carver Wayne R
Current Estimated Value
Home Financials for this Owner
Home Financials are based on the most recent Mortgage that was taken out on this home.
Original Mortgage
$81,779
Outstanding Balance
$15,565
Interest Rate
7.13%
Mortgage Type
FHA
Estimated Equity
$835,157
Purchase Details
Closed on
Jan 5, 1998
Sold by
Norwest Mtg Inc
Bought by
Hud
Purchase Details
Closed on
Oct 5, 1993
Sold by
World S&L Assoc
Bought by
Edwards Michael S and Edwards Janice C
Home Financials for this Owner
Home Financials are based on the most recent Mortgage that was taken out on this home.
Original Mortgage
$138,483
Interest Rate
6.81%
Mortgage Type
FHA
Purchase Details
Closed on
Jun 25, 1991
Create a Home Valuation Report for This Property
The Home Valuation Report is an in-depth analysis detailing your home's value as well as a comparison with similar homes in the area
Home Values in the Area
Average Home Value in this Area
Purchase History
| Date | Buyer | Sale Price | Title Company |
|---|---|---|---|
| Carver Wayne R | $143,000 | Chicago Title | |
| Hud | -- | Benefit Land Title Ins Co | |
| Norwest Mtg Inc | $148,430 | Benefit Land Title Ins Co | |
| Edwards Michael S | $140,000 | Fidelity National Title | |
| -- | $164,500 | -- |
Source: Public Records
Mortgage History
| Date | Status | Borrower | Loan Amount |
|---|---|---|---|
| Open | Carver Wayne R | $81,779 | |
| Previous Owner | Edwards Michael S | $138,483 |
Source: Public Records
Tax History Compared to Growth
Tax History
| Year | Tax Paid | Tax Assessment Tax Assessment Total Assessment is a certain percentage of the fair market value that is determined by local assessors to be the total taxable value of land and additions on the property. | Land | Improvement |
|---|---|---|---|---|
| 2025 | $3,349 | $246,338 | $100,456 | $145,882 |
| 2024 | $3,349 | $241,509 | $98,487 | $143,022 |
| 2023 | $3,285 | $236,774 | $96,556 | $140,218 |
| 2022 | $3,276 | $232,132 | $94,663 | $137,469 |
| 2021 | $3,205 | $227,581 | $92,807 | $134,774 |
| 2020 | $3,182 | $225,249 | $91,856 | $133,393 |
| 2019 | $3,139 | $220,833 | $90,055 | $130,778 |
| 2018 | $3,019 | $216,504 | $88,290 | $128,214 |
| 2017 | $2,975 | $212,259 | $86,559 | $125,700 |
| 2016 | $2,906 | $208,098 | $84,862 | $123,236 |
| 2015 | $2,887 | $204,973 | $83,588 | $121,385 |
| 2014 | $2,820 | $200,959 | $81,951 | $119,008 |
Source: Public Records
Map
Nearby Homes
- 726 Silver Dr
- 225 Diamond Way Unit 211
- 801-19 W Vista Way
- 371 N Melrose Dr Unit D
- 383 N Melrose Dr Unit G
- 359 N Melrose Dr Unit H
- 323 Hill Dr
- 233 Hill Dr
- 227 Hill Dr
- 391 N Melrose Dr Unit A
- 1283 Winchester Ct
- 0 Galaxy Dr
- 467-75 N Melrose Dr
- 1414 Janis Lynn Ln
- 1251 Remington Ct
- 1201 Stratton Dr
- 1333 Olive Ave Unit 54
- 1333 Olive Ave Unit 37
- 1333 Olive Ave Unit 62
- 748 Granada Dr