Estimated Value: $686,000 - $718,000
3
Beds
3
Baths
3,460
Sq Ft
$204/Sq Ft
Est. Value
About This Home
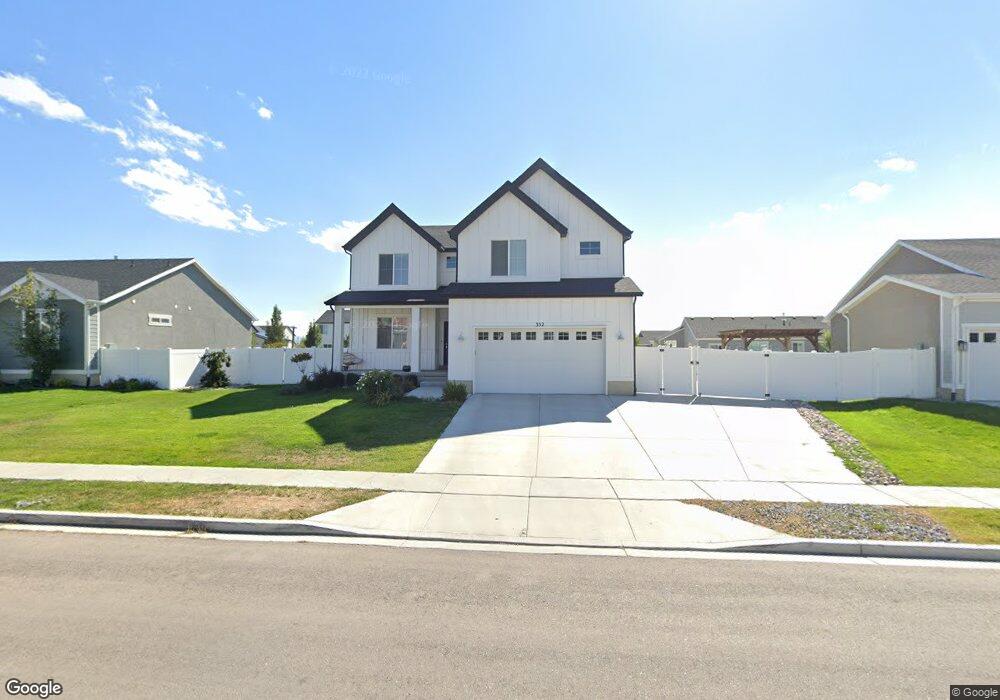
This home is located at 352 E 570 S Unit 26, Lehi, UT 84043 and is currently estimated at $706,224, approximately $204 per square foot. 352 E 570 S Unit 26 is a home located in Utah County with nearby schools including Meadow Elementary School, Lehi Junior High School, and Lehi High School.
Ownership History
Date
Name
Owned For
Owner Type
Purchase Details
Closed on
Jun 15, 2020
Sold by
Cook Briana and Cook Bennett
Bought by
Cook Bennett W and Cook Briana J
Current Estimated Value
Home Financials for this Owner
Home Financials are based on the most recent Mortgage that was taken out on this home.
Original Mortgage
$300,000
Outstanding Balance
$265,927
Interest Rate
3.2%
Mortgage Type
New Conventional
Estimated Equity
$440,297
Purchase Details
Closed on
Oct 2, 2017
Sold by
D R Horton Inc
Bought by
Cook Briana and Cook Bennett
Home Financials for this Owner
Home Financials are based on the most recent Mortgage that was taken out on this home.
Original Mortgage
$313,990
Interest Rate
3.83%
Mortgage Type
New Conventional
Purchase Details
Closed on
Dec 28, 2016
Sold by
D R Horton Inc
Bought by
Drh Energy Inc
Purchase Details
Closed on
Dec 23, 2016
Sold by
Valley Point Piont Llc
Bought by
Dr Horton Inc
Create a Home Valuation Report for This Property
The Home Valuation Report is an in-depth analysis detailing your home's value as well as a comparison with similar homes in the area
Home Values in the Area
Average Home Value in this Area
Purchase History
| Date | Buyer | Sale Price | Title Company |
|---|---|---|---|
| Cook Bennett W | -- | Meridian Title Company | |
| Cook Briana | -- | None Available | |
| Drh Energy Inc | -- | Cottonwood Title Insurance A | |
| Dr Horton Inc | -- | Cottonwood Title Ins Ag |
Source: Public Records
Mortgage History
| Date | Status | Borrower | Loan Amount |
|---|---|---|---|
| Open | Cook Bennett W | $300,000 | |
| Closed | Cook Briana | $313,990 |
Source: Public Records
Tax History Compared to Growth
Tax History
| Year | Tax Paid | Tax Assessment Tax Assessment Total Assessment is a certain percentage of the fair market value that is determined by local assessors to be the total taxable value of land and additions on the property. | Land | Improvement |
|---|---|---|---|---|
| 2025 | $2,747 | $358,820 | $270,500 | $381,900 |
| 2024 | $2,747 | $321,530 | $0 | $0 |
| 2023 | $2,565 | $325,930 | $0 | $0 |
| 2022 | $2,699 | $332,420 | $0 | $0 |
| 2021 | $2,389 | $445,000 | $156,500 | $288,500 |
| 2020 | $2,252 | $414,500 | $144,900 | $269,600 |
| 2019 | $1,982 | $379,300 | $144,900 | $234,400 |
| 2018 | $1,996 | $361,100 | $141,300 | $219,800 |
| 2017 | $805 | $77,400 | $0 | $0 |
Source: Public Records
Map
Nearby Homes
- 372 E 570 S Unit 25
- 338 E 570 S Unit 27
- 357 E 640 S Unit 20
- 333 E 640 S Unit 19
- 343 E 570 S
- 343 E 570 S Unit 3
- 377 E 640 S
- 359 E 570 S Unit 4
- 586 S 400 E Unit 24
- 589 S 300 E Unit 28
- 617 S 300 E Unit 29
- 329 E 570 S Unit 2
- 329 E 570 S
- 606 S 400 E
- 377 E 570 S Unit 5
- 377 E 570 S
- 633 S 300 E Unit 30
- 315 E 570 S Unit 1
- 393 E 640 S Unit 22
- 389 E 570 S Unit 6