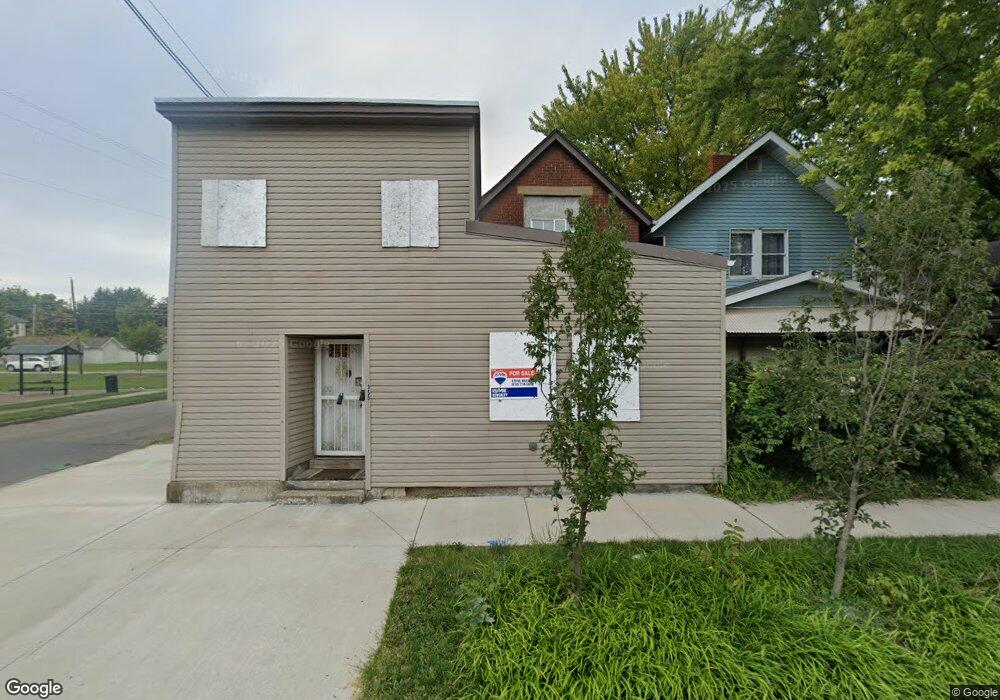
352 E Innis Ave Columbus, OH 43207
Reeb-Hosack/Hungarian Village NeighborhoodEstimated Value: $49,031
2
Beds
2
Baths
2,611
Sq Ft
$19/Sq Ft
Est. Value
About This Home
This home is located at 352 E Innis Ave, Columbus, OH 43207 and is currently estimated at $49,031, approximately $18 per square foot. 352 E Innis Ave is a home located in Franklin County with nearby schools including Southwood Elementary School, South High School, and South Columbus Preparatory Academy.
Ownership History
Date
Name
Owned For
Owner Type
Purchase Details
Closed on
Jan 21, 2026
Sold by
Corby Jeffrey
Bought by
Business Workshop Llc
Current Estimated Value
Purchase Details
Closed on
Jun 24, 2019
Sold by
Corby Jeffrey
Bought by
Central Ohio Community Improvement Cop
Purchase Details
Closed on
Oct 18, 2007
Sold by
Moore Shaun
Bought by
Corby Jeffrey
Purchase Details
Closed on
Oct 17, 2007
Sold by
Lester Tommy and Lester Carol J
Bought by
Moore Shaun
Purchase Details
Closed on
Jun 18, 2002
Sold by
Redd Dana
Bought by
Lester Tommy
Purchase Details
Closed on
Dec 10, 1999
Sold by
Wheller Roger and Johnson Michael
Bought by
Redd Dana
Purchase Details
Closed on
Aug 16, 1999
Sold by
Huffman Charles R and Johnson Michael T
Bought by
Johnson Michael and Wheeler Roger
Purchase Details
Closed on
May 14, 1997
Sold by
Walter Bailey
Bought by
Huffman Charles R and Wheeler Roger
Purchase Details
Closed on
Nov 8, 1994
Sold by
Bailey Glenna J
Bought by
Bailey Walter
Create a Home Valuation Report for This Property
The Home Valuation Report is an in-depth analysis detailing your home's value as well as a comparison with similar homes in the area
Home Values in the Area
Average Home Value in this Area
Purchase History
| Date | Buyer | Sale Price | Title Company |
|---|---|---|---|
| Business Workshop Llc | $35,200 | None Listed On Document | |
| Central Ohio Community Improvement Cop | -- | None Available | |
| Corby Jeffrey | $22,000 | Attorney | |
| Moore Shaun | $22,000 | Attorney | |
| Lester Tommy | $8,500 | Landsel Title Agency | |
| Redd Dana | $9,000 | Landsel Title Agency | |
| Johnson Michael | $12,000 | -- | |
| Huffman Charles R | $24,000 | -- | |
| Bailey Walter | $28,000 | -- |
Source: Public Records
Tax History
| Year | Tax Paid | Tax Assessment Tax Assessment Total Assessment is a certain percentage of the fair market value that is determined by local assessors to be the total taxable value of land and additions on the property. | Land | Improvement |
|---|---|---|---|---|
| 2025 | $5,941 | $12,320 | $4,340 | $7,980 |
| 2024 | $5,941 | $12,320 | $4,340 | $7,980 |
| 2023 | $2,688 | $12,320 | $4,340 | $7,980 |
| 2022 | $3,820 | $9,810 | $3,680 | $6,130 |
| 2021 | $1,776 | $9,810 | $3,680 | $6,130 |
| 2020 | $1,388 | $9,810 | $3,680 | $6,130 |
| 2019 | $1,884 | $8,900 | $3,330 | $5,570 |
| 2018 | $991 | $8,900 | $3,330 | $5,570 |
| 2017 | $1,168 | $8,900 | $3,330 | $5,570 |
| 2016 | $986 | $9,110 | $3,330 | $5,780 |
| 2015 | $937 | $9,110 | $3,330 | $5,780 |
| 2014 | $736 | $9,110 | $3,330 | $5,780 |
| 2013 | $439 | $9,100 | $3,325 | $5,775 |
Source: Public Records
Map
Nearby Homes
- 457 E Woodrow Ave Unit 459
- 292 E Barthman Ave
- 332 E Hinman Ave
- 274 E Barthman Ave
- 379 E Morrill Ave
- 1696 Parsons Ave
- 1692 Parsons Ave
- 464 E Hinman Ave
- 330 E Morrill Ave
- 1808 S 6th St Unit 810
- 1624 S 8th St
- 1862 S 6th St Unit 864
- 259 Hinkle Ave
- 172 E Woodrow Ave
- 177 E Hinman Ave
- 495 E Welch Ave
- 160 E Barthman Ave
- 1657 Ann St
- 1858 S 5th St Unit 860
- 149 E Hinman Ave
- 350 E Innis Ave Unit 352
- 356 E Innis Ave
- 360 E Innis Ave
- 364 E Innis Ave Unit 2
- 364 E Innis Ave
- 349 E Innis Ave Unit 351
- 359 E Innis Ave
- 357 E Innis Ave
- 355 E Innis Ave Unit 357
- 1792 S Washington Ave
- 372 E Innis Ave
- 1788 S Washington Ave
- 1834 S Washington Ave
- 376 E Innis Ave
- 1787 S Washington Ave
- 1776 S Washington Ave
- 1783 S Washington Ave
- 380 E Innis Ave
- 380 E Innis Ave
- 1772 S Washington Ave
Your Personal Tour Guide
Ask me questions while you tour the home.