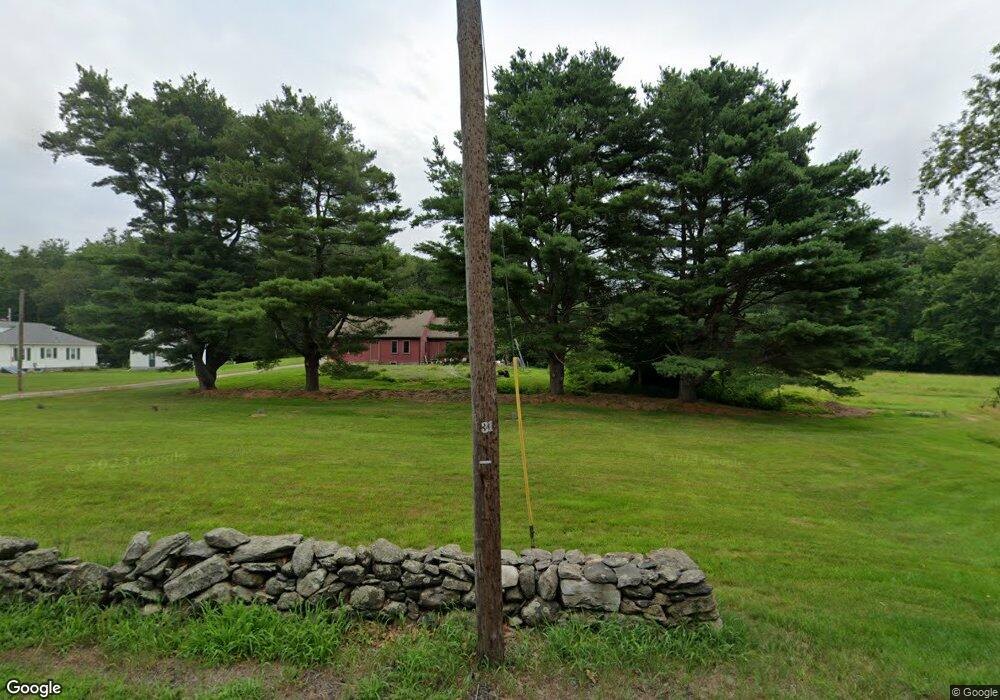
352 Grange Rd North Smithfield, RI 02896
Estimated Value: $415,068 - $538,000
4
Beds
1
Bath
1,462
Sq Ft
$327/Sq Ft
Est. Value
About This Home
This home is located at 352 Grange Rd, North Smithfield, RI 02896 and is currently estimated at $477,767, approximately $326 per square foot. 352 Grange Rd is a home located in Providence County with nearby schools including North Smithfield Elementary School, North Smithfield Middle School, and North Smithfield High School.
Ownership History
Date
Name
Owned For
Owner Type
Purchase Details
Closed on
Dec 28, 2018
Sold by
Warrener Mark
Bought by
Sansoucy Donald M and Sansoucy Huang C
Current Estimated Value
Purchase Details
Closed on
Jun 14, 2018
Sold by
Christopher R North Re
Bought by
Warrener Mark
Purchase Details
Closed on
Jun 12, 2017
Sold by
North Christopher R
Bought by
Chrsitopher R North Re
Create a Home Valuation Report for This Property
The Home Valuation Report is an in-depth analysis detailing your home's value as well as a comparison with similar homes in the area
Home Values in the Area
Average Home Value in this Area
Purchase History
| Date | Buyer | Sale Price | Title Company |
|---|---|---|---|
| Sansoucy Donald M | $225,000 | -- | |
| Warrener Mark | $220,000 | -- | |
| Chrsitopher R North Re | -- | -- |
Source: Public Records
Mortgage History
| Date | Status | Borrower | Loan Amount |
|---|---|---|---|
| Previous Owner | Chrsitopher R North Re | $110,000 | |
| Previous Owner | Chrsitopher R North Re | $23,000 |
Source: Public Records
Tax History Compared to Growth
Tax History
| Year | Tax Paid | Tax Assessment Tax Assessment Total Assessment is a certain percentage of the fair market value that is determined by local assessors to be the total taxable value of land and additions on the property. | Land | Improvement |
|---|---|---|---|---|
| 2024 | $3,242 | $219,500 | $118,600 | $100,900 |
| 2023 | $3,128 | $219,500 | $118,600 | $100,900 |
| 2022 | $3,053 | $219,500 | $118,600 | $100,900 |
| 2021 | $3,655 | $224,400 | $78,600 | $145,800 |
| 2020 | $3,655 | $224,400 | $78,600 | $145,800 |
| 2019 | $3,561 | $224,400 | $78,600 | $145,800 |
| 2018 | $2,705 | $156,900 | $85,400 | $71,500 |
| 2017 | $2,621 | $155,800 | $85,400 | $70,400 |
| 2016 | $2,549 | $155,800 | $85,400 | $70,400 |
| 2015 | $2,947 | $176,700 | $103,600 | $73,100 |
| 2014 | $2,589 | $161,600 | $103,600 | $58,000 |
Source: Public Records
Map
Nearby Homes
- 540 Greenville Rd
- 539 Douglas Pike
- 850 Black Plain Rd
- 0 Follett St Unit 1394978
- 0 Taber Hill Rd Unit 1396868
- 389 Douglas Pike
- 7 Stone Ridge Dr
- 711 Black Plain Rd
- 0 Douglas Pike
- 132 Greenville Rd
- 450 Log Rd
- 111 Sayles Hill Rd
- 230 George Washington Hwy
- 0 Lot A Old Smithfield Rd N
- 250 George Washington Hwy
- 245 Reservoir Rd
- 223 Reservoir Rd
- 235 Reservoir Rd
- 229 Reservoir Rd
- 0 Christina Way Unit 1360886
- 350 Grange Rd
- 5 Rocky Hill Rd
- 361 Grange Rd
- 390 Grange Rd
- 391 Grange Rd
- 410 Grange Rd
- 351 Grange Rd
- 15 Rocky Hill Rd
- 419 Grange Rd
- 60 Rocky Hill Rd
- 313 Grange Rd
- 331 Grange Rd
- 25 Rocky Hill Rd
- 445 Grange Rd
- 283 Grange Rd
- 2138 Providence Pike
- 111 Rocky Hill Rd
- 281 Grange Rd
- 2110 Providence Pike
- 2002 Providence Pike