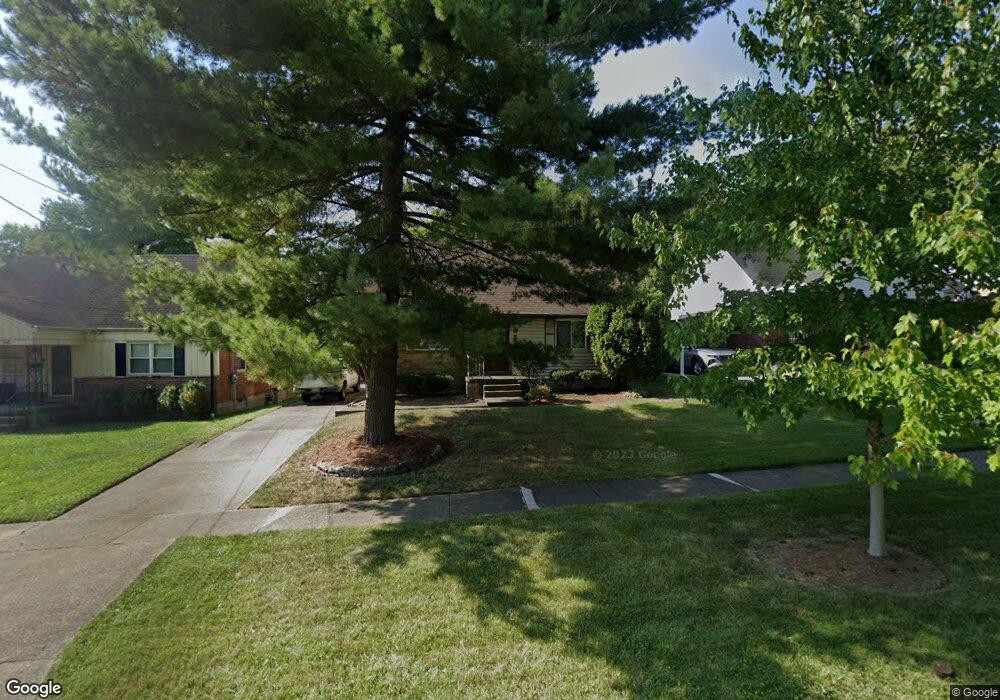
352 Ingram Rd Cincinnati, OH 45218
Estimated Value: $243,000 - $253,000
4
Beds
2
Baths
1,701
Sq Ft
$147/Sq Ft
Est. Value
About This Home
This home is located at 352 Ingram Rd, Cincinnati, OH 45218 and is currently estimated at $249,333, approximately $146 per square foot. 352 Ingram Rd is a home located in Hamilton County with nearby schools including Central Montessori Academy and John Paul II Catholic School.
Ownership History
Date
Name
Owned For
Owner Type
Purchase Details
Closed on
Apr 4, 2018
Sold by
Anaple Gary M
Bought by
Anaple Gary M
Current Estimated Value
Purchase Details
Closed on
Mar 10, 2003
Sold by
Elsie Anaple
Bought by
Anaple Elsie M and Elsie M Anaple Trust
Home Financials for this Owner
Home Financials are based on the most recent Mortgage that was taken out on this home.
Original Mortgage
$119,227
Interest Rate
5.94%
Purchase Details
Closed on
Sep 27, 2001
Sold by
Elsie Anaple and Elsie M
Bought by
Anaple Elsie M and The Elsie M Anaple Trust
Create a Home Valuation Report for This Property
The Home Valuation Report is an in-depth analysis detailing your home's value as well as a comparison with similar homes in the area
Home Values in the Area
Average Home Value in this Area
Purchase History
| Date | Buyer | Sale Price | Title Company |
|---|---|---|---|
| Anaple Gary M | -- | None Available | |
| Anaple Elsie M | -- | -- | |
| Anaple Elsie M | -- | -- | |
| Anaple Elsie M | -- | -- |
Source: Public Records
Mortgage History
| Date | Status | Borrower | Loan Amount |
|---|---|---|---|
| Closed | Anaple Elsie M | $119,227 |
Source: Public Records
Tax History
| Year | Tax Paid | Tax Assessment Tax Assessment Total Assessment is a certain percentage of the fair market value that is determined by local assessors to be the total taxable value of land and additions on the property. | Land | Improvement |
|---|---|---|---|---|
| 2025 | $4,607 | $62,216 | $8,988 | $53,228 |
| 2023 | $4,013 | $62,216 | $8,988 | $53,228 |
| 2022 | $3,397 | $39,358 | $6,976 | $32,382 |
| 2021 | $3,397 | $39,358 | $6,976 | $32,382 |
| 2020 | $3,358 | $39,358 | $6,976 | $32,382 |
| 2019 | $3,281 | $33,639 | $5,961 | $27,678 |
| 2018 | $2,353 | $33,639 | $5,961 | $27,678 |
| 2017 | $2,173 | $33,639 | $5,961 | $27,678 |
| 2016 | $2,255 | $34,115 | $6,440 | $27,675 |
| 2015 | $2,128 | $34,115 | $6,440 | $27,675 |
| 2014 | $2,179 | $34,115 | $6,440 | $27,675 |
| 2013 | $2,365 | $37,083 | $7,000 | $30,083 |
Source: Public Records
Map
Nearby Homes
- 1 Jennings Rd
- 16 Japonica Dr
- 34 Gambier Cir
- 38 Handel Ln
- 31 Flanders Ln
- 11 Dewitt Ct
- 37 Hayden Dr
- 9 Dewitt Ct
- 7 Dewitt Ct
- 6 Chalmers Ct
- 48 Damon Rd
- 11 Ashby St
- 6 Belknap Place 1
- 1013 Ligorio Ave
- 1105 Inner Circle Dr
- 23 Briarwood Ln
- 1314 Waycross Rd
- 564 Waycross Rd
- 602 Brightview Place Unit 34
- 11315 Lincolnshire Dr
Your Personal Tour Guide
Ask me questions while you tour the home.