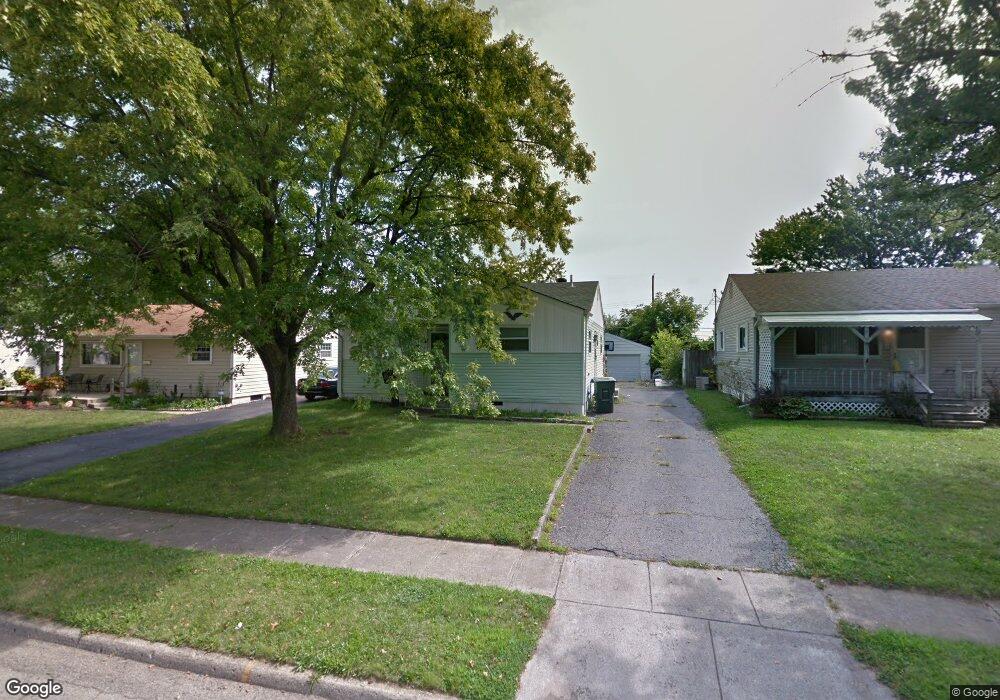
352 N Brinker Ave Columbus, OH 43204
Valleyview Heights NeighborhoodEstimated Value: $164,000 - $209,000
3
Beds
2
Baths
971
Sq Ft
$184/Sq Ft
Est. Value
About This Home
This home is located at 352 N Brinker Ave, Columbus, OH 43204 and is currently estimated at $178,898, approximately $184 per square foot. 352 N Brinker Ave is a home located in Franklin County with nearby schools including Valleyview Elementary School, Westmoor Middle School, and West High School.
Ownership History
Date
Name
Owned For
Owner Type
Purchase Details
Closed on
Nov 16, 2022
Sold by
Griffith John S and Griffith Susan E
Bought by
Aguirre Jose L
Current Estimated Value
Purchase Details
Closed on
Feb 28, 2008
Sold by
Griffith John S
Bought by
Griffith John S and Griffith Susan E
Home Financials for this Owner
Home Financials are based on the most recent Mortgage that was taken out on this home.
Original Mortgage
$65,000
Interest Rate
5.19%
Mortgage Type
Purchase Money Mortgage
Purchase Details
Closed on
Jan 11, 2008
Sold by
Tirey Timothy A and Leonard Edward
Bought by
Griffith John S
Home Financials for this Owner
Home Financials are based on the most recent Mortgage that was taken out on this home.
Original Mortgage
$65,000
Interest Rate
5.19%
Mortgage Type
Purchase Money Mortgage
Purchase Details
Closed on
Aug 24, 1998
Sold by
Tirey Charles E and Estate Of Berdena Jayen Lynch
Bought by
Tirey Timothy Allen
Purchase Details
Closed on
Jul 1, 1986
Create a Home Valuation Report for This Property
The Home Valuation Report is an in-depth analysis detailing your home's value as well as a comparison with similar homes in the area
Home Values in the Area
Average Home Value in this Area
Purchase History
| Date | Buyer | Sale Price | Title Company |
|---|---|---|---|
| Aguirre Jose L | $70,000 | Columbus Title | |
| Griffith John S | -- | Attorney | |
| Griffith John S | $12,300 | None Available | |
| Tirey Timothy Allen | $65,000 | Preferred Title Agency Inc | |
| -- | $52,500 | -- |
Source: Public Records
Mortgage History
| Date | Status | Borrower | Loan Amount |
|---|---|---|---|
| Previous Owner | Griffith John S | $65,000 |
Source: Public Records
Tax History
| Year | Tax Paid | Tax Assessment Tax Assessment Total Assessment is a certain percentage of the fair market value that is determined by local assessors to be the total taxable value of land and additions on the property. | Land | Improvement |
|---|---|---|---|---|
| 2025 | $2,544 | $52,230 | $9,560 | $42,670 |
| 2024 | $2,544 | $52,230 | $9,560 | $42,670 |
| 2023 | $2,388 | $49,455 | $9,555 | $39,900 |
| 2022 | $1,503 | $28,280 | $9,170 | $19,110 |
| 2021 | $1,506 | $28,280 | $9,170 | $19,110 |
| 2020 | $1,508 | $28,280 | $9,170 | $19,110 |
| 2019 | $1,465 | $23,560 | $7,630 | $15,930 |
| 2018 | $1,365 | $23,560 | $7,630 | $15,930 |
| 2017 | $1,902 | $30,590 | $7,630 | $22,960 |
| 2016 | $1,391 | $20,480 | $6,020 | $14,460 |
| 2015 | $1,267 | $20,480 | $6,020 | $14,460 |
| 2014 | $1,270 | $20,480 | $6,020 | $14,460 |
| 2013 | $696 | $22,750 | $6,685 | $16,065 |
Source: Public Records
Map
Nearby Homes
- 355-357 N Algonquin Ave
- 3215 Valleyview Dr
- 160 N Sylvan Ave
- 154-156 N Huron Ave
- 94 Orel Ave
- 107 Haldy Ave
- 162 S Roys Ave
- 75 N Huron Ave
- 471 N Hague Ave
- 89 N Roys Ave
- 514 N Hague Ave
- 2816-2820 Steele Ave
- 2741 Ridge Ave
- 65 N Chase Ave
- 3096 Ellis Place
- 511 N Warren Ave
- 77 S Brinker Ave
- 200-202 N Harris Ave
- 2648 Valleyview Dr
- 104-106 N Hague Ave
- 346 N Brinker Ave
- 358 N Brinker Ave
- 338 N Brinker Ave
- 364 N Brinker Ave
- 332 N Brinker Ave
- 372 N Brinker Ave
- 123 Nonmls St
- 326 N Brinker Ave
- 378 N Brinker Ave
- 351 N Brinker Ave
- 345 N Brinker Ave
- 359 N Brinker Ave
- 365 N Brinker Ave
- 337 N Brinker Ave
- 318 N Brinker Ave
- 384 N Brinker Ave
- 371 N Brinker Ave
- 331 N Brinker Ave
- 3130 Ridge Ave
- 377 N Brinker Ave
Your Personal Tour Guide
Ask me questions while you tour the home.