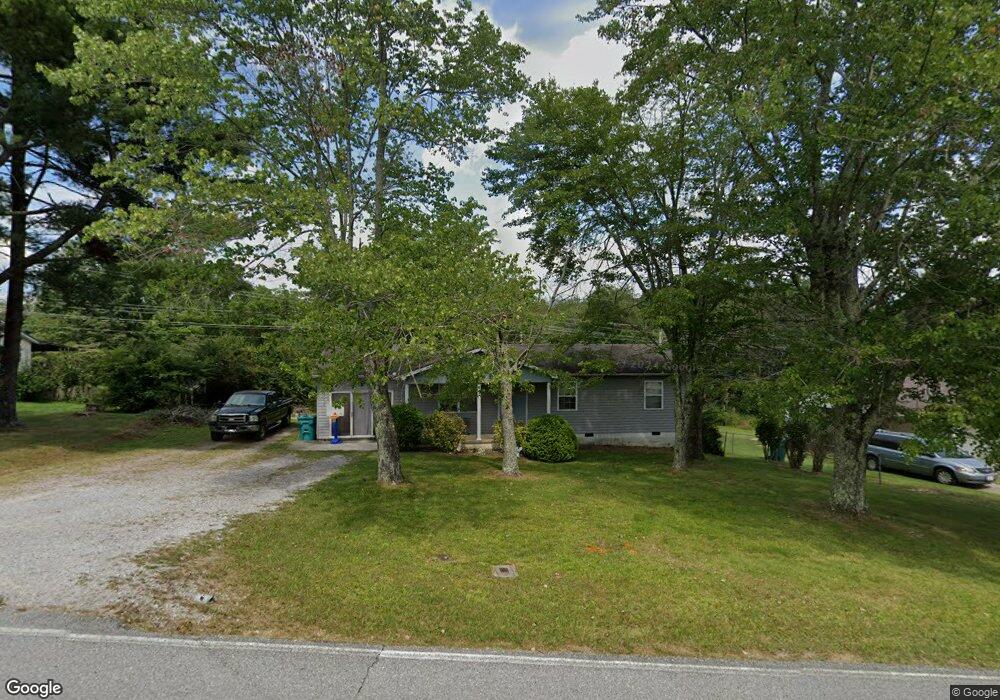
352 Netherton Ln Crossville, TN 38555
Estimated Value: $172,011 - $269,000
--
Bed
2
Baths
1,320
Sq Ft
$172/Sq Ft
Est. Value
About This Home
This home is located at 352 Netherton Ln, Crossville, TN 38555 and is currently estimated at $227,003, approximately $171 per square foot. 352 Netherton Ln is a home located in Cumberland County with nearby schools including Stone Elementary School, Stone Memorial High School, and Christian Academy of the Cumberlands.
Ownership History
Date
Name
Owned For
Owner Type
Purchase Details
Closed on
May 12, 2022
Sold by
Lori Freitag
Bought by
Freitag Philip C
Current Estimated Value
Purchase Details
Closed on
Jan 12, 2006
Sold by
Upper Cumberland Developme
Bought by
Freitag Phillip C
Purchase Details
Closed on
Jun 30, 1997
Bought by
Bookout Jannette M and Bookout Lloyd B
Purchase Details
Closed on
Jun 19, 1997
Bought by
Wattenbarger Brian S and Wattenbarger Melanie
Purchase Details
Closed on
Nov 5, 1990
Bought by
Dunn Randall L % Capp Mortg Inc
Create a Home Valuation Report for This Property
The Home Valuation Report is an in-depth analysis detailing your home's value as well as a comparison with similar homes in the area
Home Values in the Area
Average Home Value in this Area
Purchase History
| Date | Buyer | Sale Price | Title Company |
|---|---|---|---|
| Freitag Philip C | -- | Law Offices Of Howard L Upchur | |
| Freitag Phillip C | $65,000 | -- | |
| Bookout Jannette M | $58,000 | -- | |
| Wattenbarger Brian S | $42,400 | -- | |
| Dunn Randall L % Capp Mortg Inc | $42,500 | -- |
Source: Public Records
Tax History Compared to Growth
Tax History
| Year | Tax Paid | Tax Assessment Tax Assessment Total Assessment is a certain percentage of the fair market value that is determined by local assessors to be the total taxable value of land and additions on the property. | Land | Improvement |
|---|---|---|---|---|
| 2024 | -- | $31,050 | $2,000 | $29,050 |
| 2023 | $0 | $31,050 | $0 | $0 |
| 2022 | $540 | $31,050 | $2,000 | $29,050 |
| 2021 | $393 | $16,975 | $2,000 | $14,975 |
| 2020 | $266 | $16,975 | $2,000 | $14,975 |
| 2019 | $366 | $16,975 | $2,000 | $14,975 |
| 2018 | $366 | $16,975 | $2,000 | $14,975 |
| 2017 | $366 | $16,975 | $2,000 | $14,975 |
| 2016 | $363 | $16,850 | $2,000 | $14,850 |
| 2015 | $318 | $14,925 | $2,000 | $12,925 |
| 2014 | $302 | $14,914 | $0 | $0 |
Source: Public Records
Map
Nearby Homes