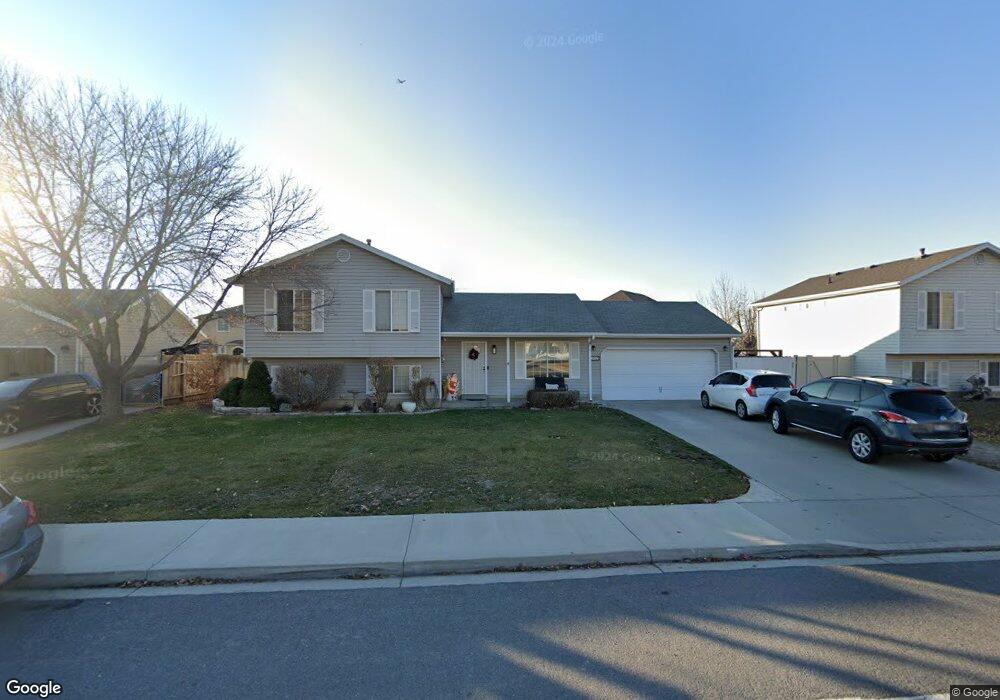
352 S 2050 W Provo, UT 84601
Franklin NeighborhoodEstimated Value: $434,000 - $469,661
3
Beds
2
Baths
1,732
Sq Ft
$261/Sq Ft
Est. Value
About This Home
This home is located at 352 S 2050 W, Provo, UT 84601 and is currently estimated at $452,915, approximately $261 per square foot. 352 S 2050 W is a home located in Utah County with nearby schools including Dixon Middle School, Provo High School, and Freedom Preparatory Academy.
Ownership History
Date
Name
Owned For
Owner Type
Purchase Details
Closed on
Apr 1, 2000
Sold by
Standefer Mark and Standefer Susan
Bought by
Standefer Mark W and Standefer Susan M
Current Estimated Value
Home Financials for this Owner
Home Financials are based on the most recent Mortgage that was taken out on this home.
Original Mortgage
$146,457
Outstanding Balance
$50,284
Interest Rate
8.26%
Mortgage Type
FHA
Estimated Equity
$402,631
Purchase Details
Closed on
Aug 26, 1999
Sold by
Wootton William B and Wootton Deborah E
Bought by
Standefer Mark and Standefer Susan
Home Financials for this Owner
Home Financials are based on the most recent Mortgage that was taken out on this home.
Original Mortgage
$119,200
Interest Rate
7.56%
Purchase Details
Closed on
May 31, 1996
Sold by
Camberlango Homes Inc
Bought by
Wootton William B and Wootton Deborah E
Home Financials for this Owner
Home Financials are based on the most recent Mortgage that was taken out on this home.
Original Mortgage
$112,300
Interest Rate
7.96%
Create a Home Valuation Report for This Property
The Home Valuation Report is an in-depth analysis detailing your home's value as well as a comparison with similar homes in the area
Home Values in the Area
Average Home Value in this Area
Purchase History
| Date | Buyer | Sale Price | Title Company |
|---|---|---|---|
| Standefer Mark W | -- | Title West Title Co | |
| Standefer Mark | -- | First American Title Ins Co | |
| Wootton William B | -- | -- |
Source: Public Records
Mortgage History
| Date | Status | Borrower | Loan Amount |
|---|---|---|---|
| Open | Standefer Mark W | $146,457 | |
| Closed | Standefer Mark | $119,200 | |
| Previous Owner | Wootton William B | $112,300 | |
| Closed | Standefer Mark | $29,800 |
Source: Public Records
Tax History Compared to Growth
Tax History
| Year | Tax Paid | Tax Assessment Tax Assessment Total Assessment is a certain percentage of the fair market value that is determined by local assessors to be the total taxable value of land and additions on the property. | Land | Improvement |
|---|---|---|---|---|
| 2025 | $2,224 | $230,615 | $154,900 | $264,400 |
| 2024 | $2,224 | $218,900 | $0 | $0 |
| 2023 | $2,185 | $212,025 | $0 | $0 |
| 2022 | $2,226 | $217,855 | $0 | $0 |
| 2021 | $1,762 | $300,700 | $87,300 | $213,400 |
| 2020 | $1,709 | $273,400 | $79,400 | $194,000 |
| 2019 | $1,568 | $260,900 | $79,400 | $181,500 |
| 2018 | $1,365 | $230,300 | $72,500 | $157,800 |
| 2017 | $1,255 | $116,325 | $0 | $0 |
| 2016 | $1,258 | $108,680 | $0 | $0 |
| 2015 | $1,156 | $100,980 | $0 | $0 |
| 2014 | $1,082 | $98,560 | $0 | $0 |
Source: Public Records
Map
Nearby Homes
- 312 S 1920 W
- 273 S 1860 W
- 1828 W 170 S
- 386 S 2390 W
- 147 S 1680 W
- 201 N Geneva Rd Unit 3
- 249 West Ln Unit 10
- 1744 W 150 N
- 227 West Ln
- 255 N 1600 W Unit 148
- 255 N 1600 W Unit 52
- 255 N 1600 W Unit 84
- 255 N 1600 W Unit 108
- 154 N 2560 W
- 478 S 1330 W
- 392 N 2150 W
- 2744 W 50 N
- 398 N 2380 W
- 1303 W 600 S
- 2727 W 220 N