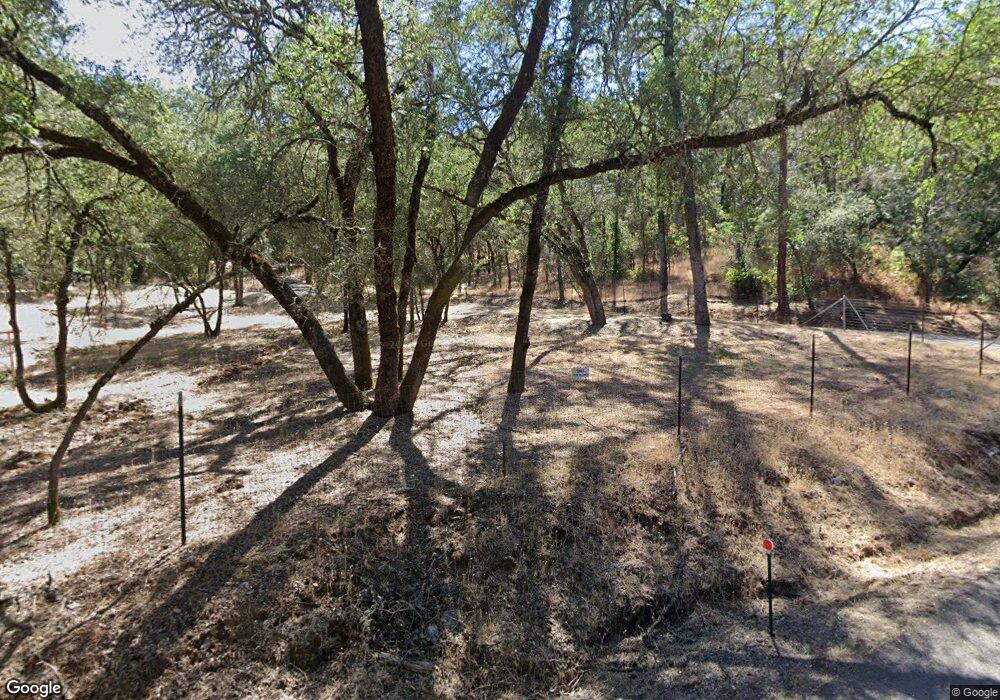
3520 Magpie Ct Placerville, CA 95667
Estimated Value: $538,764 - $876,000
1
Bed
2
Baths
1,562
Sq Ft
$420/Sq Ft
Est. Value
About This Home
This home is located at 3520 Magpie Ct, Placerville, CA 95667 and is currently estimated at $655,921, approximately $419 per square foot. 3520 Magpie Ct is a home located in El Dorado County with nearby schools including Indian Creek Elementary School, Herbert C. Green Middle School, and El Dorado High School.
Ownership History
Date
Name
Owned For
Owner Type
Purchase Details
Closed on
Sep 9, 2025
Sold by
Weiner Adam Takashi and Davia Irene
Bought by
Weiner Adam Takashi and Weiner Davia Irene
Current Estimated Value
Purchase Details
Closed on
Jun 27, 2016
Sold by
Weiner David and Weiner Melode A
Bought by
Weiner Adam and Weiner Davia
Home Financials for this Owner
Home Financials are based on the most recent Mortgage that was taken out on this home.
Original Mortgage
$435,000
Interest Rate
6.72%
Mortgage Type
New Conventional
Purchase Details
Closed on
May 22, 1998
Sold by
David Weiner and Melode Weiner Melode
Bought by
Weiner David and Weiner Melode
Home Financials for this Owner
Home Financials are based on the most recent Mortgage that was taken out on this home.
Original Mortgage
$157,500
Interest Rate
8%
Create a Home Valuation Report for This Property
The Home Valuation Report is an in-depth analysis detailing your home's value as well as a comparison with similar homes in the area
Home Values in the Area
Average Home Value in this Area
Purchase History
| Date | Buyer | Sale Price | Title Company |
|---|---|---|---|
| Weiner Adam Takashi | -- | Fidelity National Title | |
| Weiner Adam | -- | Fidelity National Title | |
| Weiner David | -- | Inter County Title Co |
Source: Public Records
Mortgage History
| Date | Status | Borrower | Loan Amount |
|---|---|---|---|
| Previous Owner | Weiner Adam | $435,000 | |
| Previous Owner | Weiner David | $157,500 |
Source: Public Records
Tax History
| Year | Tax Paid | Tax Assessment Tax Assessment Total Assessment is a certain percentage of the fair market value that is determined by local assessors to be the total taxable value of land and additions on the property. | Land | Improvement |
|---|---|---|---|---|
| 2025 | $1,863 | $176,275 | $73,730 | $102,545 |
| 2024 | $1,863 | $172,820 | $72,285 | $100,535 |
| 2023 | $1,827 | $169,432 | $70,868 | $98,564 |
| 2022 | $1,800 | $166,111 | $69,479 | $96,632 |
| 2021 | $1,776 | $162,855 | $68,117 | $94,738 |
| 2020 | $1,753 | $161,186 | $67,419 | $93,767 |
| 2019 | $1,726 | $158,027 | $66,098 | $91,929 |
| 2018 | $1,678 | $154,929 | $64,802 | $90,127 |
| 2017 | $1,649 | $151,892 | $63,532 | $88,360 |
| 2016 | $1,631 | $148,915 | $62,287 | $86,628 |
| 2015 | $1,549 | $146,680 | $61,352 | $85,328 |
| 2014 | $1,549 | $143,808 | $60,151 | $83,657 |
Source: Public Records
Map
Nearby Homes
- 0 Grassy Run Rd Unit 226031966
- 5772 Dragon Springs Rd
- 3500 Indian Creek Rd
- 5825 Dragon Springs Rd
- 5611 Meesha Ln
- 4041 Glider Rd
- 2660 Sleepy Hollow Dr
- 5200 Deerwood Dr
- 3390 Morel Way
- 2580 Golden Fawn Trail
- 2311 Fieldstone Dr
- 0 Echo Ln Unit 226012331
- 5373 Prairie Loop
- 4201 Irish Port Ln
- 2405 Greensboro Rd
- 0 Browns Rd Unit 225114992
- 4460 Fawn St
- 6425 Sharp Ln
- 4117 El Dorado Rd
- 0 Lisa Ln Unit 226022265
- 5780 Treasure Ln
- 5600 Treasure Ln
- 5825 Treasure Ln
- 5810 Green Valley Rd
- 5681 Treasure Ln
- 5840 Treasure Ln
- 5760 Treasure Ln
- 18 Treasure Ln
- 3574 Magpie Ct
- 5721 Treasure Ln
- 3560 Wildwood Ln
- 3560 Wildwood Ln
- 3541 Wildwood Ln
- 5740 Green Valley Rd
- 5354 Buck Mountain Rd
- 5900 Green Valley Rd
- 5891 Green Valley Rd
- 5700 Green Valley Rd
- 3538 Wildwood Ln
- 3600 Magpie Ct
Your Personal Tour Guide
Ask me questions while you tour the home.