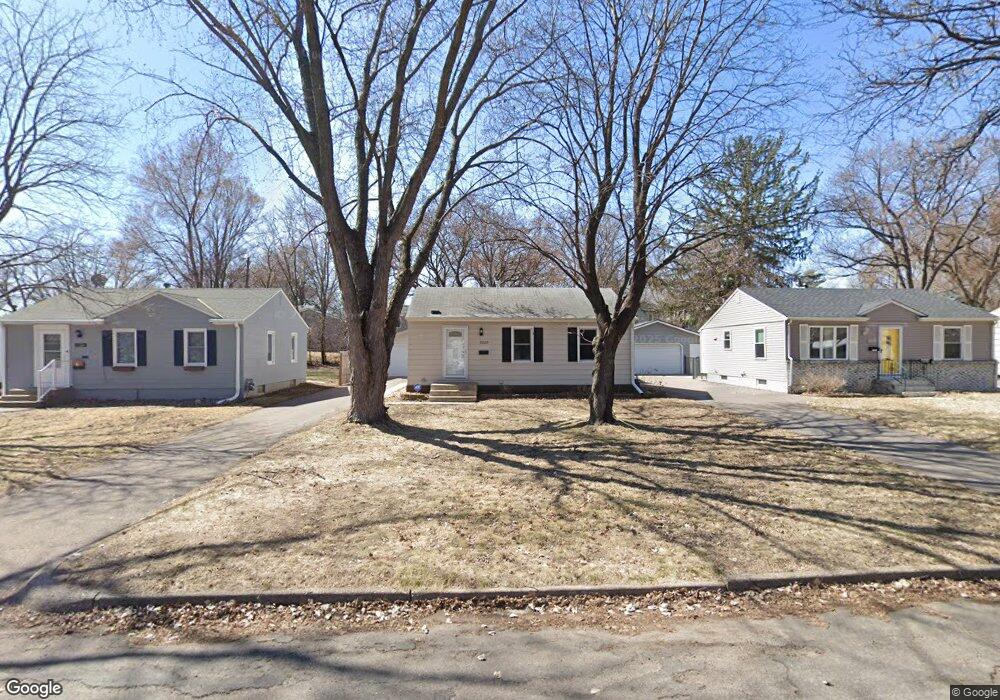
3520 Wyoming Ave S Saint Louis Park, MN 55426
Aquila NeighborhoodEstimated Value: $333,039 - $352,000
3
Beds
1
Bath
738
Sq Ft
$461/Sq Ft
Est. Value
About This Home
This home is located at 3520 Wyoming Ave S, Saint Louis Park, MN 55426 and is currently estimated at $340,010, approximately $460 per square foot. 3520 Wyoming Ave S is a home located in Hennepin County with nearby schools including Aquila Elementary School, St. Louis Park Middle School, and St. Louis Park High School.
Ownership History
Date
Name
Owned For
Owner Type
Purchase Details
Closed on
Apr 29, 2020
Sold by
Robertson Bryan
Bought by
Heisick Austin and Heisick Rebekah
Current Estimated Value
Home Financials for this Owner
Home Financials are based on the most recent Mortgage that was taken out on this home.
Original Mortgage
$251,275
Outstanding Balance
$221,687
Interest Rate
3.3%
Mortgage Type
New Conventional
Estimated Equity
$118,323
Purchase Details
Closed on
May 18, 2015
Sold by
Barbara Barbara
Bought by
Robertson Bryan Bryan
Home Financials for this Owner
Home Financials are based on the most recent Mortgage that was taken out on this home.
Original Mortgage
$180,090
Interest Rate
3.85%
Purchase Details
Closed on
Nov 14, 2014
Sold by
Johnson Sandi
Bought by
Peterson Blaine M
Purchase Details
Closed on
Oct 29, 2009
Sold by
Boring Bonnie
Bought by
Lehman Patrick
Purchase Details
Closed on
Sep 14, 2000
Sold by
Boring Bonnie I
Bought by
Lehman Patrick Arthur
Create a Home Valuation Report for This Property
The Home Valuation Report is an in-depth analysis detailing your home's value as well as a comparison with similar homes in the area
Home Values in the Area
Average Home Value in this Area
Purchase History
| Date | Buyer | Sale Price | Title Company |
|---|---|---|---|
| Heisick Austin | $264,500 | Watermark Title Agency | |
| Robertson Bryan Bryan | $200,100 | -- | |
| Peterson Blaine M | $98,888 | None Available | |
| Lehman Patrick | $85,000 | -- | |
| Lehman Patrick Arthur | $85,000 | -- |
Source: Public Records
Mortgage History
| Date | Status | Borrower | Loan Amount |
|---|---|---|---|
| Open | Heisick Austin | $251,275 | |
| Previous Owner | Robertson Bryan Bryan | $180,090 | |
| Closed | Lehman Patrick Arthur | -- |
Source: Public Records
Tax History Compared to Growth
Tax History
| Year | Tax Paid | Tax Assessment Tax Assessment Total Assessment is a certain percentage of the fair market value that is determined by local assessors to be the total taxable value of land and additions on the property. | Land | Improvement |
|---|---|---|---|---|
| 2024 | $4,094 | $308,600 | $135,700 | $172,900 |
| 2023 | $4,014 | $309,500 | $135,700 | $173,800 |
| 2022 | $3,474 | $312,200 | $129,300 | $182,900 |
| 2021 | $2,958 | $270,900 | $112,500 | $158,400 |
| 2020 | $3,198 | $237,100 | $107,200 | $129,900 |
| 2019 | $3,138 | $244,700 | $102,100 | $142,600 |
| 2018 | $2,857 | $233,200 | $97,300 | $135,900 |
| 2017 | $2,460 | $188,600 | $77,000 | $111,600 |
| 2016 | $1,922 | $149,200 | $69,500 | $79,700 |
| 2015 | $2,025 | $151,600 | $65,000 | $86,600 |
| 2014 | -- | $136,700 | $61,700 | $75,000 |
Source: Public Records
Map
Nearby Homes
- 3505 Wyoming Ave S
- 3601 Texas Ave S
- 3416 Sumter Ave S
- 3304 Yukon Ave S
- 8200 W 33rd St Unit 208
- 8200 W 33rd St Unit 222
- 8200 W 33rd St Unit 305
- 3613 Rhode Island Ave S
- 3200 Virginia Ave S Unit 209
- 1217 Oxford St
- 3633 Quebec Ave S
- 3624 Pennsylvania Ave S
- 3220 Aquila Ln S
- 8930 N Minnehaha Cir
- 3337 Decatur Ln
- 3101 Sumter Ave S
- 7436 North St
- 3024 Aquila Ave S
- 3650 Gettysburg Ave S Unit 100
- 3320 Louisiana Ave S Unit 311
- 3524 Wyoming Ave S
- 3514 Wyoming Ave S
- 3514 Wyoming Ave S
- 3528 Wyoming Ave S
- 3510 Wyoming Ave S
- 3521 Xylon Ave S
- 3521 Xylon Ave S
- 3511 3511 Wyoming-Avenue-s
- 3517 Xylon Ave S
- 3529 3529 Wyoming Ave S
- 3525 Xylon Ave S
- 3510 3510 Wyoming-Avenue-s
- 3532 Wyoming Ave S
- 3504 Wyoming Ave S
- 3513 Xylon Ave S
- 3529 Xylon Ave S
- 3515 Wyoming Ave S
- 3525 Wyoming Ave S
- 3533 Xylon Ave S
- 3536 Wyoming Ave S