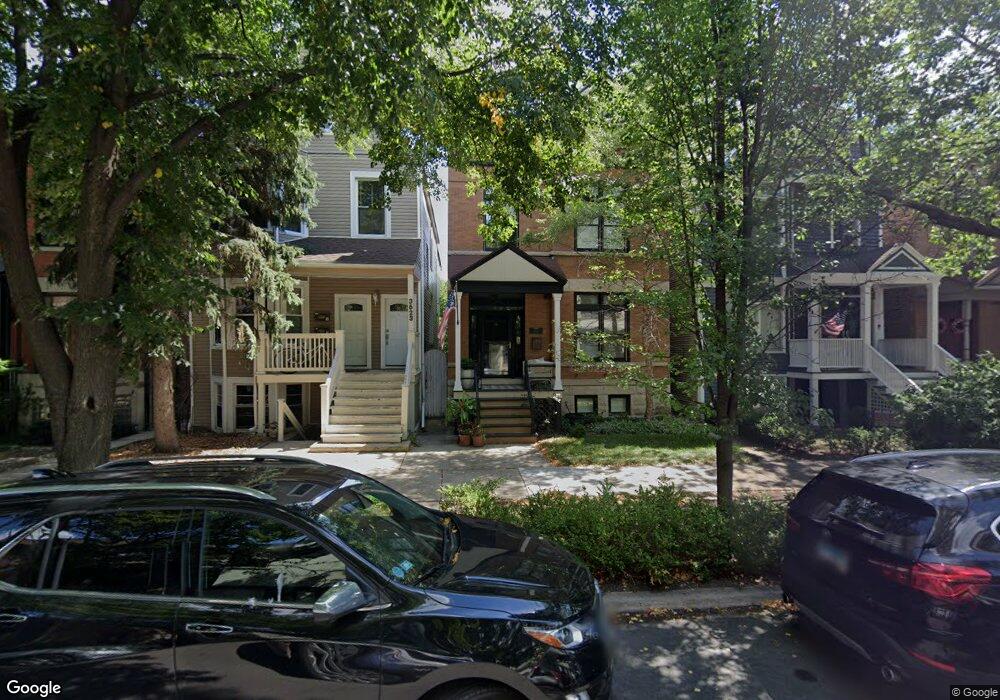
3521 N Hermitage Ave Chicago, IL 60657
Southport Corridor NeighborhoodEstimated Value: $1,255,000 - $1,768,000
4
Beds
3
Baths
1,954
Sq Ft
$762/Sq Ft
Est. Value
About This Home
This home is located at 3521 N Hermitage Ave, Chicago, IL 60657 and is currently estimated at $1,488,669, approximately $761 per square foot. 3521 N Hermitage Ave is a home located in Cook County with nearby schools including Hamilton Elementary School, Lake View High School, and Saint Andrew School.
Ownership History
Date
Name
Owned For
Owner Type
Purchase Details
Closed on
Jul 18, 2020
Sold by
Calkins Mary B and Declaration Of Tr Of Mary Bren
Bought by
Calkins Mary B and Declaration Of Tr Of Mary Bren
Current Estimated Value
Home Financials for this Owner
Home Financials are based on the most recent Mortgage that was taken out on this home.
Original Mortgage
$189,909
Outstanding Balance
$164,364
Interest Rate
2.25%
Mortgage Type
New Conventional
Estimated Equity
$1,324,305
Purchase Details
Closed on
Sep 27, 2011
Sold by
Calkins Mary Brennan
Bought by
Trust Of Mary Brennan Calkins
Purchase Details
Closed on
Apr 29, 1999
Sold by
Springgate Scott Roland and Springgate Debbie R
Bought by
Calkins Robert E and Calkins Mary B
Home Financials for this Owner
Home Financials are based on the most recent Mortgage that was taken out on this home.
Original Mortgage
$391,500
Interest Rate
6.75%
Create a Home Valuation Report for This Property
The Home Valuation Report is an in-depth analysis detailing your home's value as well as a comparison with similar homes in the area
Home Values in the Area
Average Home Value in this Area
Purchase History
| Date | Buyer | Sale Price | Title Company |
|---|---|---|---|
| Calkins Mary B | -- | Amrock Llc | |
| Trust Of Mary Brennan Calkins | -- | None Available | |
| Calkins Robert E | $435,000 | -- |
Source: Public Records
Mortgage History
| Date | Status | Borrower | Loan Amount |
|---|---|---|---|
| Open | Calkins Mary B | $189,909 | |
| Closed | Calkins Robert E | $391,500 |
Source: Public Records
Tax History Compared to Growth
Tax History
| Year | Tax Paid | Tax Assessment Tax Assessment Total Assessment is a certain percentage of the fair market value that is determined by local assessors to be the total taxable value of land and additions on the property. | Land | Improvement |
|---|---|---|---|---|
| 2024 | $21,077 | $111,001 | $48,438 | $62,563 |
| 2023 | $20,525 | $103,213 | $39,063 | $64,150 |
| 2022 | $20,525 | $103,213 | $39,063 | $64,150 |
| 2021 | $20,085 | $103,211 | $39,062 | $64,149 |
| 2020 | $14,636 | $68,803 | $17,500 | $51,303 |
| 2019 | $16,266 | $84,391 | $17,500 | $66,891 |
| 2018 | $15,991 | $84,391 | $17,500 | $66,891 |
| 2017 | $14,659 | $71,470 | $15,625 | $55,845 |
| 2016 | $13,815 | $71,470 | $15,625 | $55,845 |
| 2015 | $14,755 | $80,521 | $15,625 | $64,896 |
| 2014 | $11,038 | $59,494 | $12,500 | $46,994 |
| 2013 | $10,820 | $59,494 | $12,500 | $46,994 |
Source: Public Records
Map
Nearby Homes
- 1753 W Cornelia Ave
- 1807 W Addison St Unit 2W
- 3621 N Ravenswood Ave
- 1743 W Newport Ave
- 1833 W Addison St Unit 2
- 3448 N Ashland Ave Unit 2S
- 3438 N Ashland Ave Unit 2N
- 1642 W Wolfram St
- 3342 N Ravenswood Ave
- 3418 N Wolcott Ave Unit 1
- 3422 N Bosworth Ave Unit 1
- 3507 N Bosworth Ave
- 1753 W Henderson St
- 3644 N Bosworth Ave
- 1931 W Cornelia Ave
- 3723 N Wolcott Ave
- 1714 W Grace St Unit 2W
- 3255 N Paulina St Unit 2B
- 1645 W School St Unit 418
- 3719 N Bosworth Ave
- 3519 N Hermitage Ave Unit 1
- 3519 N Hermitage Ave
- 3523 N Hermitage Ave Unit 2
- 3523 N Hermitage Ave
- 3517 N Hermitage Ave
- 3517 N Hermitage Ave
- 3527 N Hermitage Ave Unit 2
- 3527 N Hermitage Ave
- 3527 N Hermitage Ave Unit 1
- 3527 N Hermitage Ave
- 3513 N Hermitage Ave
- 3529 N Hermitage Ave
- 3511 N Hermitage Ave
- 3531 N Hermitage Ave
- 3533 N Hermitage Ave
- 3520 N Paulina St
- 3526 N Paulina St
- 3516 N Paulina St
- 3513 N Lincoln Ave Unit 2B
- 3513 N Lincoln Ave Unit B