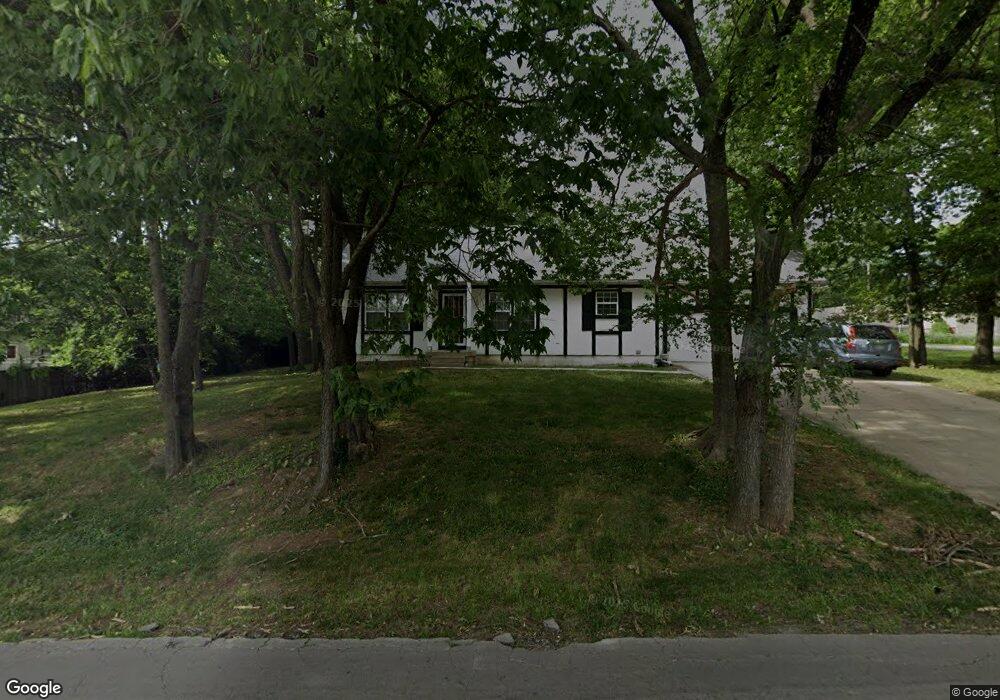
3522 E 73rd St Kansas City, MO 64132
Noble And Gregory Ridge NeighborhoodEstimated Value: $144,000 - $179,516
3
Beds
3
Baths
1,651
Sq Ft
$99/Sq Ft
Est. Value
About This Home
This home is located at 3522 E 73rd St, Kansas City, MO 64132 and is currently estimated at $162,879, approximately $98 per square foot. 3522 E 73rd St is a home located in Jackson County with nearby schools including Benjamin Banneker Elementary School, Central Middle School, and Southeast High School.
Ownership History
Date
Name
Owned For
Owner Type
Purchase Details
Closed on
Oct 15, 2022
Sold by
Thompson-Williams Evelyn J
Bought by
Riddlespriger George L
Current Estimated Value
Purchase Details
Closed on
Dec 26, 2019
Sold by
Thompson Ronald
Bought by
Thompson Evelyn J
Purchase Details
Closed on
Jun 27, 2012
Sold by
Riddlespriger George
Bought by
Thompson Ronald and Thompson Evelyn J
Purchase Details
Closed on
May 10, 2006
Sold by
Thompson Evelyn J and Thompson Ronald
Bought by
Thompson Ronald and Thompson Evelyn J
Home Financials for this Owner
Home Financials are based on the most recent Mortgage that was taken out on this home.
Original Mortgage
$101,250
Interest Rate
8.55%
Mortgage Type
Stand Alone Refi Refinance Of Original Loan
Purchase Details
Closed on
Sep 29, 1995
Sold by
East Meyer Community Assn
Bought by
Riddlespriger George and Riddlespriger George L
Create a Home Valuation Report for This Property
The Home Valuation Report is an in-depth analysis detailing your home's value as well as a comparison with similar homes in the area
Home Values in the Area
Average Home Value in this Area
Purchase History
| Date | Buyer | Sale Price | Title Company |
|---|---|---|---|
| Riddlespriger George L | -- | -- | |
| Thompson Evelyn J | -- | None Available | |
| Thompson Ronald | -- | None Available | |
| Thompson Ronald | -- | Nations Title Agency Of Kans | |
| Riddlespriger George | -- | Ati Title |
Source: Public Records
Mortgage History
| Date | Status | Borrower | Loan Amount |
|---|---|---|---|
| Previous Owner | Thompson Ronald | $101,250 |
Source: Public Records
Tax History Compared to Growth
Tax History
| Year | Tax Paid | Tax Assessment Tax Assessment Total Assessment is a certain percentage of the fair market value that is determined by local assessors to be the total taxable value of land and additions on the property. | Land | Improvement |
|---|---|---|---|---|
| 2025 | $1,375 | $20,040 | $4,944 | $15,096 |
| 2024 | $1,362 | $17,427 | $12,156 | $5,271 |
| 2023 | $1,362 | $17,427 | $1,184 | $16,243 |
| 2022 | $1,563 | $19,000 | $2,470 | $16,530 |
| 2021 | $1,558 | $19,000 | $2,470 | $16,530 |
| 2020 | $1,383 | $16,659 | $2,470 | $14,189 |
| 2019 | $1,354 | $16,659 | $2,470 | $14,189 |
| 2018 | $1,386 | $17,415 | $2,547 | $14,868 |
| 2017 | $1,386 | $17,415 | $2,547 | $14,868 |
| 2016 | $1,359 | $16,979 | $648 | $16,331 |
| 2014 | $1,363 | $16,979 | $648 | $16,331 |
Source: Public Records
Map
Nearby Homes
- 7216 Indiana Ave
- 7341 Cleveland Ave
- 3909 E 73rd St
- 7325 Walrond Ave
- 7426 Indiana Ave
- 3500 E 75th St
- 7301 Myrtle Ave
- 7119 Bellefontaine Ave
- 7115 Bellefontaine Ave
- 3913 E 73rd St
- 7015 College Ave
- 7103 Agnes Ave
- 6942 College Ave
- 7040 Agnes Ave
- 6933 Walrond Ave
- 7012 Jackson Ave
- 6947 Bellefontaine Ave
- 7004 Jackson Ave
- 7012 S Benton Ave
- 6821 Bales Ave