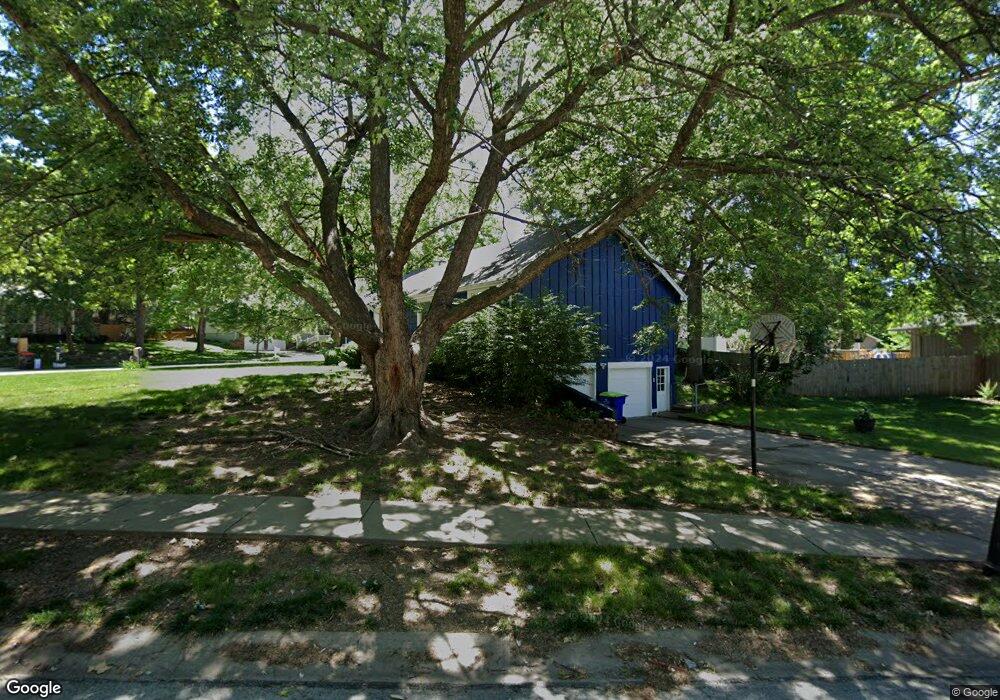
3522 NE Grant St Lees Summit, MO 64064
Chapel Ridge NeighborhoodEstimated Value: $297,150 - $346,000
3
Beds
4
Baths
1,326
Sq Ft
$243/Sq Ft
Est. Value
About This Home
This home is located at 3522 NE Grant St, Lees Summit, MO 64064 and is currently estimated at $321,788, approximately $242 per square foot. 3522 NE Grant St is a home located in Jackson County with nearby schools including Chapel Lakes Elementary School, Delta Woods Middle School, and Blue Springs South High School.
Ownership History
Date
Name
Owned For
Owner Type
Purchase Details
Closed on
Apr 19, 2016
Sold by
Hounchell Carrie M
Bought by
Hounchell Carrie M and Hounchell Jerry D
Current Estimated Value
Home Financials for this Owner
Home Financials are based on the most recent Mortgage that was taken out on this home.
Original Mortgage
$136,252
Outstanding Balance
$108,244
Interest Rate
3.68%
Mortgage Type
FHA
Estimated Equity
$213,544
Purchase Details
Closed on
May 18, 2005
Sold by
Lewis Donnie R and Lewis Yong H
Bought by
Hounchell Carrie M
Home Financials for this Owner
Home Financials are based on the most recent Mortgage that was taken out on this home.
Original Mortgage
$122,720
Interest Rate
7.44%
Mortgage Type
Fannie Mae Freddie Mac
Purchase Details
Closed on
Nov 22, 1995
Sold by
Miller John Anthony and Miller Alexandra S
Bought by
Lewis Donnie R and Lewis Yong H
Home Financials for this Owner
Home Financials are based on the most recent Mortgage that was taken out on this home.
Original Mortgage
$77,812
Interest Rate
7.48%
Mortgage Type
FHA
Create a Home Valuation Report for This Property
The Home Valuation Report is an in-depth analysis detailing your home's value as well as a comparison with similar homes in the area
Home Values in the Area
Average Home Value in this Area
Purchase History
| Date | Buyer | Sale Price | Title Company |
|---|---|---|---|
| Hounchell Carrie M | -- | Bchh Inc | |
| Hounchell Carrie M | -- | Coffelt Land Title Inc | |
| Lewis Donnie R | -- | Old Republic Title Company |
Source: Public Records
Mortgage History
| Date | Status | Borrower | Loan Amount |
|---|---|---|---|
| Open | Hounchell Carrie M | $136,252 | |
| Closed | Hounchell Carrie M | $122,720 | |
| Previous Owner | Lewis Donnie R | $77,812 |
Source: Public Records
Tax History Compared to Growth
Tax History
| Year | Tax Paid | Tax Assessment Tax Assessment Total Assessment is a certain percentage of the fair market value that is determined by local assessors to be the total taxable value of land and additions on the property. | Land | Improvement |
|---|---|---|---|---|
| 2025 | $3,271 | $40,455 | $8,153 | $32,302 |
| 2024 | $3,212 | $42,710 | $6,850 | $35,860 |
| 2023 | $3,212 | $42,710 | $6,308 | $36,402 |
| 2022 | $2,598 | $30,590 | $6,356 | $24,234 |
| 2021 | $2,595 | $30,590 | $6,356 | $24,234 |
| 2020 | $2,498 | $29,120 | $6,356 | $22,764 |
| 2019 | $2,421 | $29,120 | $6,356 | $22,764 |
| 2018 | $2,139 | $24,952 | $3,548 | $21,404 |
| 2017 | $2,139 | $24,952 | $3,548 | $21,404 |
| 2016 | $2,021 | $23,655 | $4,142 | $19,513 |
| 2014 | $1,806 | $21,001 | $4,386 | $16,615 |
Source: Public Records
Map
Nearby Homes
- 405 NE Grant Ct
- 3743 NE Woodland Ct
- 3709 NE Grant St
- 3607 NE Stanton St
- 3723 NE Chapel Dr
- 3731 NE Chapel Dr
- 4004 NE Independence Ave
- 4005 NE Channel Dr
- 3905 NE Beechwood Dr
- 201 NW Redwood Ct
- 3620 NE Ralph Powell Rd
- 203 NE Shoreview Dr
- 4017 NE Channel Dr
- 202 NW Redwood Ct
- 801 NE Lone Hill Dr
- 793 NE Algonquin St Unit A
- 3608 NW Blue Jacket Dr
- 4015 NE Sagamore Dr
- 824 NE Algonquin St Unit A
- 208 NE Landings Cir
- 3520 NE Grant St
- 3583 NE Chapel Dr
- 4196 NE Chapel Manor Dr
- 3584 NE Chapel Dr
- 3521 NE Grant St
- 3600 NE Grant St
- 3519 NE Grant St
- 3586 NE Chapel Dr
- 3585 NE Chapel Dr
- 404 NE Grant Ct
- 3601 NE Grant St
- 402 NE Grant Ct
- 3588 NE Chapel Dr
- 3602 NE Grant St
- 3517 NE Grant St
- 3587 NE Chapel Dr
- 411 NE Cole Ct
- 413 NE Cole Ct
- 3603 NE Grant St
- 3604 NE Grant St