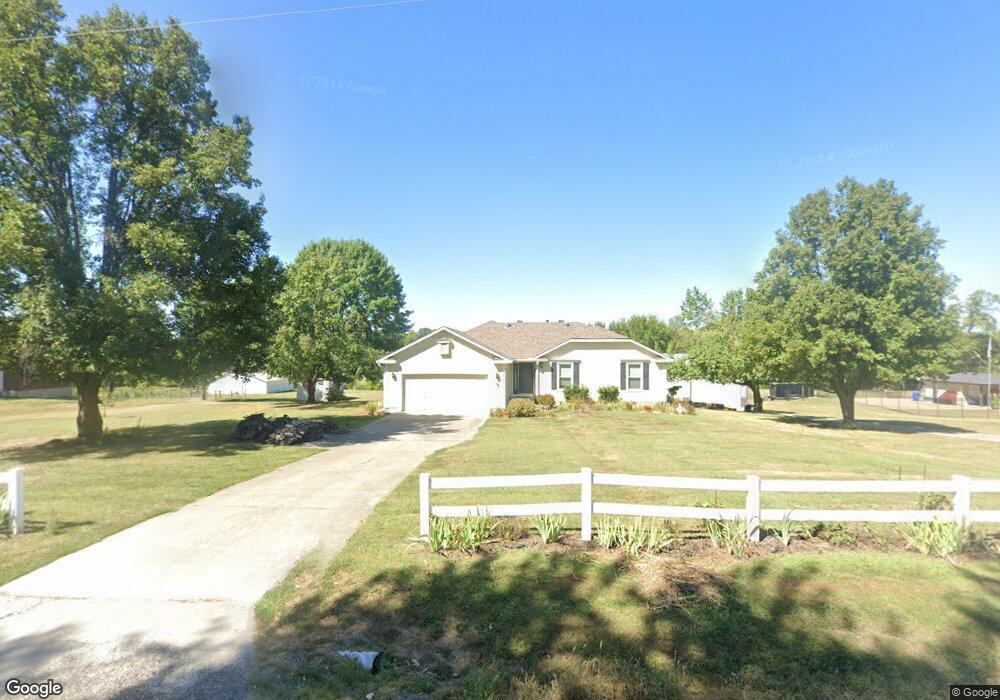
3522 S Sweeney Rd Grain Valley, MO 64029
Estimated Value: $401,949 - $505,000
3
Beds
2
Baths
1,771
Sq Ft
$254/Sq Ft
Est. Value
About This Home
This home is located at 3522 S Sweeney Rd, Grain Valley, MO 64029 and is currently estimated at $448,987, approximately $253 per square foot. 3522 S Sweeney Rd is a home located in Jackson County with nearby schools including Grain Valley High School.
Ownership History
Date
Name
Owned For
Owner Type
Purchase Details
Closed on
May 26, 2008
Sold by
Campbell Roger E and Stanbrough Nancy C
Bought by
Mays Fred R and Mays Mary Penne
Current Estimated Value
Home Financials for this Owner
Home Financials are based on the most recent Mortgage that was taken out on this home.
Original Mortgage
$119,500
Outstanding Balance
$73,637
Interest Rate
5.37%
Mortgage Type
Purchase Money Mortgage
Estimated Equity
$375,350
Purchase Details
Closed on
Feb 15, 1996
Sold by
Sousley Logan O and Sousley Frances M
Bought by
Campbell Roger E and Campbell Nancy C
Home Financials for this Owner
Home Financials are based on the most recent Mortgage that was taken out on this home.
Original Mortgage
$53,000
Interest Rate
7.01%
Mortgage Type
Purchase Money Mortgage
Purchase Details
Closed on
Oct 16, 1995
Sold by
Campbell Roger E and Campbell Nancy C
Bought by
Sousley Logan O and Sousley Frances M
Purchase Details
Closed on
Oct 3, 1995
Sold by
Turner Homer R and Turner Edna M
Bought by
Campbell Roger E and Campbell Nancy C
Create a Home Valuation Report for This Property
The Home Valuation Report is an in-depth analysis detailing your home's value as well as a comparison with similar homes in the area
Purchase History
| Date | Buyer | Sale Price | Title Company |
|---|---|---|---|
| Mays Fred R | -- | Heart Of America Title & Esc | |
| Campbell Roger E | -- | -- | |
| Sousley Logan O | -- | -- | |
| Campbell Roger E | -- | -- |
Source: Public Records
Mortgage History
| Date | Status | Borrower | Loan Amount |
|---|---|---|---|
| Open | Mays Fred R | $119,500 | |
| Previous Owner | Campbell Roger E | $53,000 |
Source: Public Records
Tax History
| Year | Tax Paid | Tax Assessment Tax Assessment Total Assessment is a certain percentage of the fair market value that is determined by local assessors to be the total taxable value of land and additions on the property. | Land | Improvement |
|---|---|---|---|---|
| 2025 | $3,371 | $54,235 | $11,981 | $42,254 |
| 2024 | $3,231 | $47,162 | $9,618 | $37,544 |
| 2023 | $3,231 | $47,162 | $8,491 | $38,671 |
| 2022 | $3,545 | $46,550 | $4,028 | $42,522 |
| 2021 | $3,446 | $46,550 | $4,028 | $42,522 |
| 2020 | $3,271 | $44,353 | $4,028 | $40,325 |
| 2019 | $3,190 | $44,353 | $4,028 | $40,325 |
| 2018 | $2,859 | $37,218 | $13,788 | $23,430 |
| 2017 | $2,859 | $37,218 | $13,788 | $23,430 |
| 2016 | $2,785 | $36,286 | $5,633 | $30,653 |
| 2014 | -- | $36,286 | $5,633 | $30,653 |
Source: Public Records
Map
Nearby Homes
- 3826 S Sweeney Rd
- 34010 E Pink Hill Rd
- 904 NW Lindenwood Dr
- TBD E Duncan Rd
- 205 NE Hoot Owl St
- 913 NW Hickorywood Dr
- 1806 NW Mya Ct
- 2304 NW Rymeg Dr
- 1809 NW Madi Ct
- 950 NW Maplewood Ct
- 952 NW Maplewood Ct
- 803 NW Redbud Dr
- 33602 E Pink Hill Rd
- 1716 NW Nicholas Dr
- 1701 NW Helen Ct
- 1810 NW Bradford Ct
- 216 NE Greystone Way
- 1451 S Buckner Tarsney Rd
- 3111 S Fields Rd
- 816 NW Cedar Ln
- 3602 S Sweeney Rd
- 3514 S Sweeney Rd
- 3621 S Sweeney Rd
- 3506 S Sweeney Rd
- 33415 E Pink Hill Rd
- 3616 S Sweeney Rd
- 3622 S Sweeney Rd
- 33411 Pinehurst Ln
- 33303 E Pink Hill Rd
- 33406 Pinehurst Ln
- 33405 Pinehurst Ln
- 34005 E Pink Hill Rd
- 3702 S Sweeney Rd
- 33109 E Pink Hill Rd
- 34007 E Pink Hill Rd
- 33009 E Pink Hill Rd
- 33104 E Pink Hill Rd
- 34004 E Pink Hill Rd
- 33003 E Pink Hill Rd
- 3302 S Colonial Dr
Your Personal Tour Guide
Ask me questions while you tour the home.