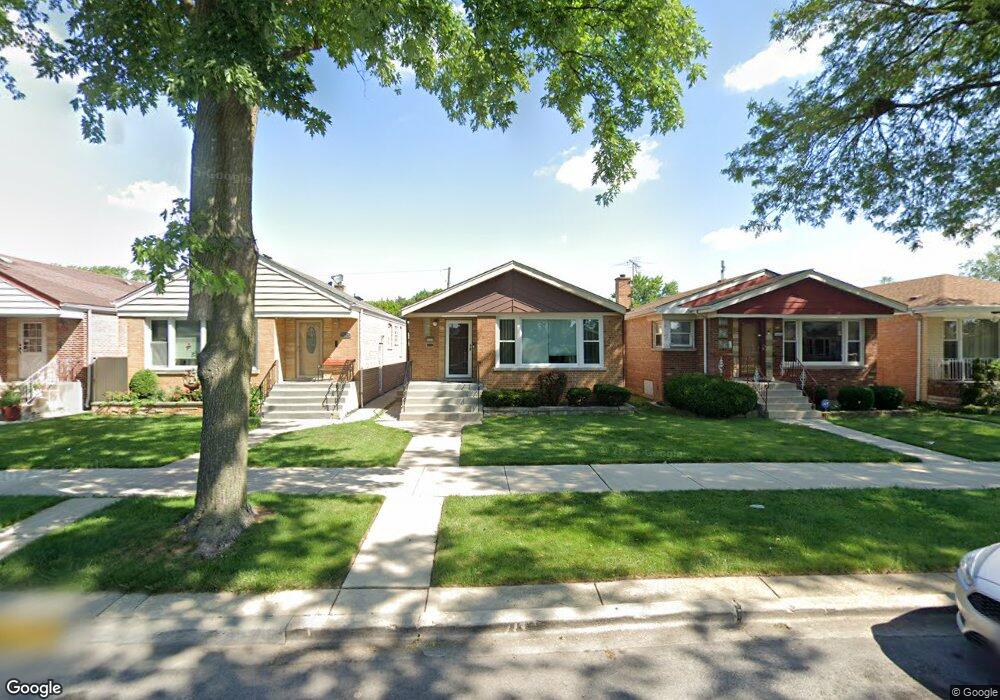
3522 W 78th St Chicago, IL 60652
Ashburn NeighborhoodEstimated Value: $226,000 - $304,000
3
Beds
1
Bath
1,008
Sq Ft
$272/Sq Ft
Est. Value
About This Home
This home is located at 3522 W 78th St, Chicago, IL 60652 and is currently estimated at $274,101, approximately $271 per square foot. 3522 W 78th St is a home located in Cook County with nearby schools including Hampton Elementary Fine & Perf Arts School and Bogan Computer Technical High School.
Ownership History
Date
Name
Owned For
Owner Type
Purchase Details
Closed on
Jul 11, 2016
Sold by
Gold Patricia Ann
Bought by
King Auis Lamont
Current Estimated Value
Purchase Details
Closed on
May 28, 2005
Sold by
Gold Patricia
Bought by
Gold Patricia and King Avis L
Purchase Details
Closed on
Jul 24, 2002
Sold by
King Avis L and Gold Patricia A
Bought by
Gold Patricia A
Home Financials for this Owner
Home Financials are based on the most recent Mortgage that was taken out on this home.
Original Mortgage
$128,000
Interest Rate
8.5%
Purchase Details
Closed on
May 27, 1999
Sold by
Viteri Guillermo E and Viteri Mirian
Bought by
Gold Patricia A and King Avis L
Home Financials for this Owner
Home Financials are based on the most recent Mortgage that was taken out on this home.
Original Mortgage
$108,108
Interest Rate
7.68%
Mortgage Type
FHA
Create a Home Valuation Report for This Property
The Home Valuation Report is an in-depth analysis detailing your home's value as well as a comparison with similar homes in the area
Home Values in the Area
Average Home Value in this Area
Purchase History
| Date | Buyer | Sale Price | Title Company |
|---|---|---|---|
| King Auis Lamont | -- | None Available | |
| Gold Patricia | -- | -- | |
| Gold Patricia A | -- | -- | |
| Gold Patricia A | $109,000 | -- |
Source: Public Records
Mortgage History
| Date | Status | Borrower | Loan Amount |
|---|---|---|---|
| Previous Owner | Gold Patricia A | $128,000 | |
| Previous Owner | Gold Patricia A | $108,108 |
Source: Public Records
Tax History Compared to Growth
Tax History
| Year | Tax Paid | Tax Assessment Tax Assessment Total Assessment is a certain percentage of the fair market value that is determined by local assessors to be the total taxable value of land and additions on the property. | Land | Improvement |
|---|---|---|---|---|
| 2024 | $3,115 | $20,000 | $2,250 | $17,750 |
| 2023 | $3,016 | $18,000 | $3,000 | $15,000 |
| 2022 | $3,016 | $18,000 | $3,000 | $15,000 |
| 2021 | $2,950 | $18,000 | $3,000 | $15,000 |
| 2020 | $2,157 | $12,721 | $3,000 | $9,721 |
| 2019 | $2,165 | $14,135 | $3,000 | $11,135 |
| 2018 | $2,127 | $14,135 | $3,000 | $11,135 |
| 2017 | $2,152 | $13,306 | $2,625 | $10,681 |
| 2016 | $2,179 | $13,306 | $2,625 | $10,681 |
| 2015 | $1,972 | $13,306 | $2,625 | $10,681 |
| 2014 | $1,939 | $12,939 | $2,437 | $10,502 |
| 2013 | $1,890 | $12,939 | $2,437 | $10,502 |
Source: Public Records
Map
Nearby Homes
- 3506 W 78th St
- 3505 W 77th Place
- 3534 W 76th St
- 7826 S Christiana Ave
- 7809 S Christiana Ave
- 7701 S Christiana Ave
- 3530 W 80th Place
- 7756 S Spaulding Ave
- 7513 S Saint Louis Ave
- 7917 S Christiana Ave Unit 1
- 3617 W 80th Place
- 7719 S Spaulding Ave
- 3631 W 80th Place
- 7509 S Trumbull Ave
- 3813 W 78th St
- 3827 W Hayford St
- 3644 W 82nd St
- 3406 W 74th St
- 8118 S Spaulding Ave
- 3720 W 82nd St
- 3524 W 78th St
- 3518 W 78th St
- 3526 W 78th St
- 3516 W 78th St
- 3530 W 78th St
- 3512 W 78th St
- 3534 W 78th St
- 3510 W 78th St
- 3523 W 77th Place
- 3519 W 77th Place
- 3525 W 77th Place
- 3536 W 78th St
- 3515 W 77th Place
- 3529 W 77th Place
- 3513 W 77th Place
- 3531 W 77th Place
- 3504 W 78th St
- 3511 W 77th Place
- 3535 W 77th Place
- 3523 W 78th St