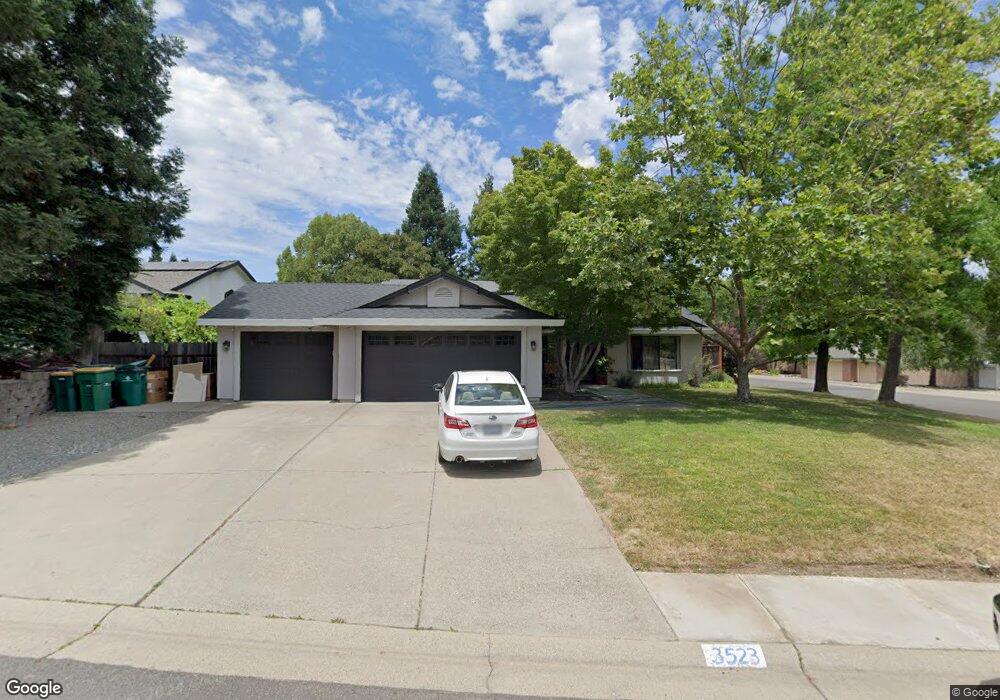
3523 Covello Cir Cameron Park, CA 95682
Estimated Value: $591,000 - $759,000
3
Beds
2
Baths
1,705
Sq Ft
$388/Sq Ft
Est. Value
About This Home
This home is located at 3523 Covello Cir, Cameron Park, CA 95682 and is currently estimated at $661,630, approximately $388 per square foot. 3523 Covello Cir is a home located in El Dorado County with nearby schools including Camerado Springs Middle School, Ponderosa High School, and Buckeye Union Mandarin Immersion Charter School.
Ownership History
Date
Name
Owned For
Owner Type
Purchase Details
Closed on
Jun 11, 2021
Sold by
Crawford Jesse A and Crawford Julie M
Bought by
Crawford Julie M and Crawford Jesse A
Current Estimated Value
Home Financials for this Owner
Home Financials are based on the most recent Mortgage that was taken out on this home.
Original Mortgage
$520,000
Outstanding Balance
$470,795
Interest Rate
2.9%
Mortgage Type
New Conventional
Estimated Equity
$190,835
Purchase Details
Closed on
Nov 24, 2020
Sold by
Crawford Jesse A and Crawford Julie M
Bought by
Crawford Jesse A and Crawford Julie M
Purchase Details
Closed on
Oct 24, 1994
Sold by
Kullman Timothy G and Kullman Donna J
Bought by
Crawford Jesse A and Crawford Julie M
Home Financials for this Owner
Home Financials are based on the most recent Mortgage that was taken out on this home.
Original Mortgage
$153,375
Interest Rate
9.23%
Mortgage Type
FHA
Create a Home Valuation Report for This Property
The Home Valuation Report is an in-depth analysis detailing your home's value as well as a comparison with similar homes in the area
Home Values in the Area
Average Home Value in this Area
Purchase History
| Date | Buyer | Sale Price | Title Company |
|---|---|---|---|
| Crawford Julie M | -- | North American Title Co Inc | |
| Crawford Jesse A | -- | None Available | |
| Crawford Jesse A | $164,000 | First American Title Co |
Source: Public Records
Mortgage History
| Date | Status | Borrower | Loan Amount |
|---|---|---|---|
| Open | Crawford Julie M | $520,000 | |
| Previous Owner | Crawford Jesse A | $153,375 |
Source: Public Records
Tax History Compared to Growth
Tax History
| Year | Tax Paid | Tax Assessment Tax Assessment Total Assessment is a certain percentage of the fair market value that is determined by local assessors to be the total taxable value of land and additions on the property. | Land | Improvement |
|---|---|---|---|---|
| 2025 | $3,008 | $275,431 | $100,762 | $174,669 |
| 2024 | $3,008 | $270,032 | $98,787 | $171,245 |
| 2023 | $2,952 | $264,738 | $96,850 | $167,888 |
| 2022 | $2,911 | $259,548 | $94,951 | $164,597 |
| 2021 | $2,874 | $254,460 | $93,090 | $161,370 |
| 2020 | $2,837 | $251,852 | $92,136 | $159,716 |
| 2019 | $2,791 | $246,915 | $90,330 | $156,585 |
| 2018 | $2,723 | $242,074 | $88,559 | $153,515 |
| 2017 | $9,376 | $237,328 | $86,823 | $150,505 |
| 2016 | $9,351 | $232,675 | $85,121 | $147,554 |
| 2015 | $2,565 | $229,183 | $83,844 | $145,339 |
| 2014 | $2,565 | $224,695 | $82,202 | $142,493 |
Source: Public Records
Map
Nearby Homes
- 3810 Bilbao Ct
- 3481 Montero Rd
- 2555 Westridge Dr
- 3018 Camerosa Cir
- 4659 Abrijo Rd
- 310 Milazzo Ct
- 2541 Knollwood Dr
- 4236 Gailey Cir
- 3538 Chelsea Rd
- 3334 Hollow Oak Dr
- 2595 Meadow Ln Unit 4
- 3831 Sheridan Rd
- 3098 Oakwood Rd
- 2624 Country Club Dr
- 4329 Crazy Horse Rd
- 0 Crazy Horse Rd
- 0 Cameo Dr Unit 225125171
- 7137 Cinnamon Teal Way
- 3182 Birmingham Way
- 4733 Thoreau Dr
- 3519 Covello Cir
- 4672 Castana Dr
- 4681 Castana Dr
- 4677 Castana Dr
- 3524 Covello Cir
- 3511 Covello Cir
- 3520 Covello Cir
- 4662 Castana Dr
- 4671 Castana Dr
- 4500 Caland Ct
- 4703 Castana Dr
- 3508 Covello Cir
- 3501 Covello Cir
- 4706 Castana Dr
- 4665 Castana Dr
- 4707 Castana Dr
- 3563 Christa Ct
- 3553 Covello Cir
- 4501 Caland Ct
- 3500 Covello Cir