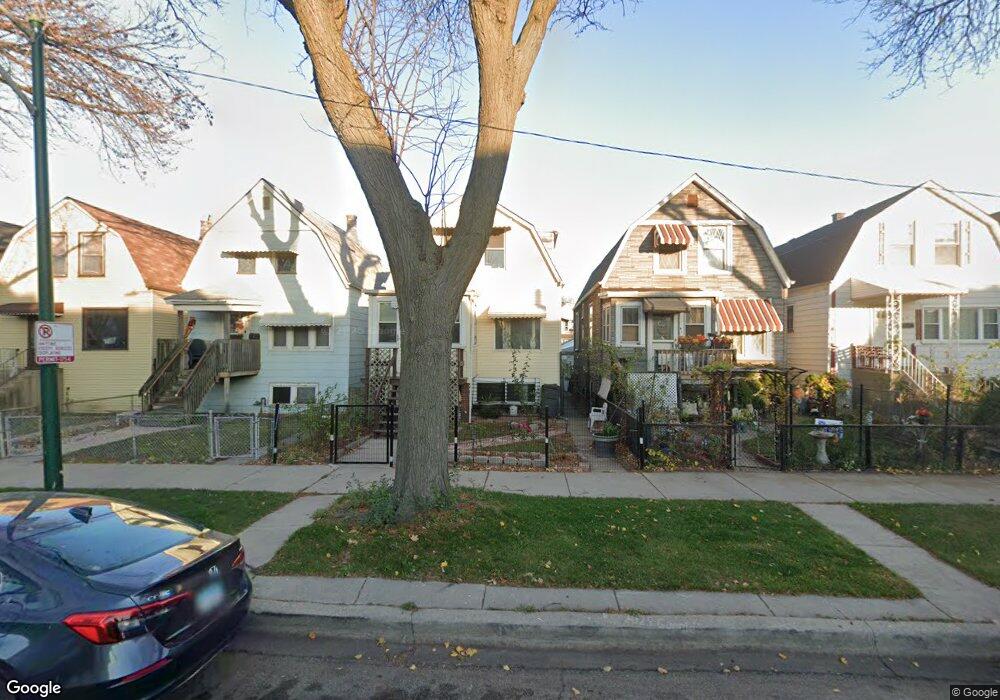
3523 S Mozart St Chicago, IL 60632
Brighton Park NeighborhoodEstimated Value: $205,000 - $330,165
4
Beds
1
Bath
1,320
Sq Ft
$196/Sq Ft
Est. Value
About This Home
This home is located at 3523 S Mozart St, Chicago, IL 60632 and is currently estimated at $258,291, approximately $195 per square foot. 3523 S Mozart St is a home located in Cook County with nearby schools including Burroughs Elementary School, Kelly High School, and Acero - Sandra Cisneros Elementary School.
Ownership History
Date
Name
Owned For
Owner Type
Purchase Details
Closed on
Apr 17, 2007
Sold by
Estrada Yolanda and Estrada Adriana
Bought by
Caraga Joseph and Estrada Adriana
Current Estimated Value
Home Financials for this Owner
Home Financials are based on the most recent Mortgage that was taken out on this home.
Original Mortgage
$166,000
Outstanding Balance
$100,699
Interest Rate
6.21%
Mortgage Type
New Conventional
Estimated Equity
$157,592
Purchase Details
Closed on
Feb 17, 2006
Sold by
Estrada Martin
Bought by
Estrada Yolanda and Estrada Adriana
Purchase Details
Closed on
Dec 22, 2003
Sold by
Wodarski John E
Bought by
Estrada Martin and Estrada Yolanda
Home Financials for this Owner
Home Financials are based on the most recent Mortgage that was taken out on this home.
Original Mortgage
$156,785
Interest Rate
5.91%
Mortgage Type
FHA
Create a Home Valuation Report for This Property
The Home Valuation Report is an in-depth analysis detailing your home's value as well as a comparison with similar homes in the area
Home Values in the Area
Average Home Value in this Area
Purchase History
| Date | Buyer | Sale Price | Title Company |
|---|---|---|---|
| Caraga Joseph | -- | None Available | |
| Estrada Yolanda | -- | Ticor Title Ins Co 2002 | |
| Estrada Martin | $159,000 | Atg Search |
Source: Public Records
Mortgage History
| Date | Status | Borrower | Loan Amount |
|---|---|---|---|
| Open | Caraga Joseph | $166,000 | |
| Previous Owner | Estrada Martin | $156,785 |
Source: Public Records
Tax History Compared to Growth
Tax History
| Year | Tax Paid | Tax Assessment Tax Assessment Total Assessment is a certain percentage of the fair market value that is determined by local assessors to be the total taxable value of land and additions on the property. | Land | Improvement |
|---|---|---|---|---|
| 2024 | $3,414 | $15,000 | $9,497 | $5,503 |
| 2023 | $3,307 | $19,410 | $7,875 | $11,535 |
| 2022 | $3,307 | $19,410 | $7,875 | $11,535 |
| 2021 | $3,233 | $19,410 | $7,875 | $11,535 |
| 2020 | $3,656 | $19,410 | $6,300 | $13,110 |
| 2019 | $3,716 | $21,809 | $6,300 | $15,509 |
| 2018 | $3,653 | $21,809 | $6,300 | $15,509 |
| 2017 | $2,663 | $15,664 | $5,355 | $10,309 |
| 2016 | $2,655 | $15,664 | $5,355 | $10,309 |
| 2015 | $2,407 | $15,664 | $5,355 | $10,309 |
| 2014 | $2,406 | $15,438 | $3,780 | $11,658 |
| 2013 | $2,348 | $15,438 | $3,780 | $11,658 |
Source: Public Records
Map
Nearby Homes
- 2820 W 36th St
- 3609 S California Ave
- 3527 S Rockwell St
- 2733 W 38th St
- 3535 S Maplewood Ave Unit 4
- 3000 W 38th St
- 3750 S Rockwell St
- 2737 W 38th Place
- 3034 W 38th Place
- 2728 W 39th Place
- 3543 S Artesian Ave
- 3915 S Sacramento Ave
- 3444 S Western Ave
- 3638 S Western Ave Unit F
- 3638 S Western Ave Unit E
- 3638 S Western Ave Unit A
- 2409 W 32nd Place
- 2415 W 32nd Place
- 2318 W 35th Place
- 2434 W Pershing Rd
- 3525 S Mozart St
- 3521 S Mozart St
- 3527 S Mozart St
- 3519 S Mozart St
- 3529 S Mozart St
- 3515 S Mozart St
- 3531 S Mozart St
- 3531 S Mozart St
- 3513 S Mozart St
- 3533 S Mozart St
- 3511 S Mozart St
- 3522 S California Ave
- 3524 S California Ave
- 3520 S California Ave
- 3537 S Mozart St
- 3526 S California Ave
- 3518 S California Ave
- 3509 S Mozart St
- 3528 S California Ave
- 3514 S California Ave