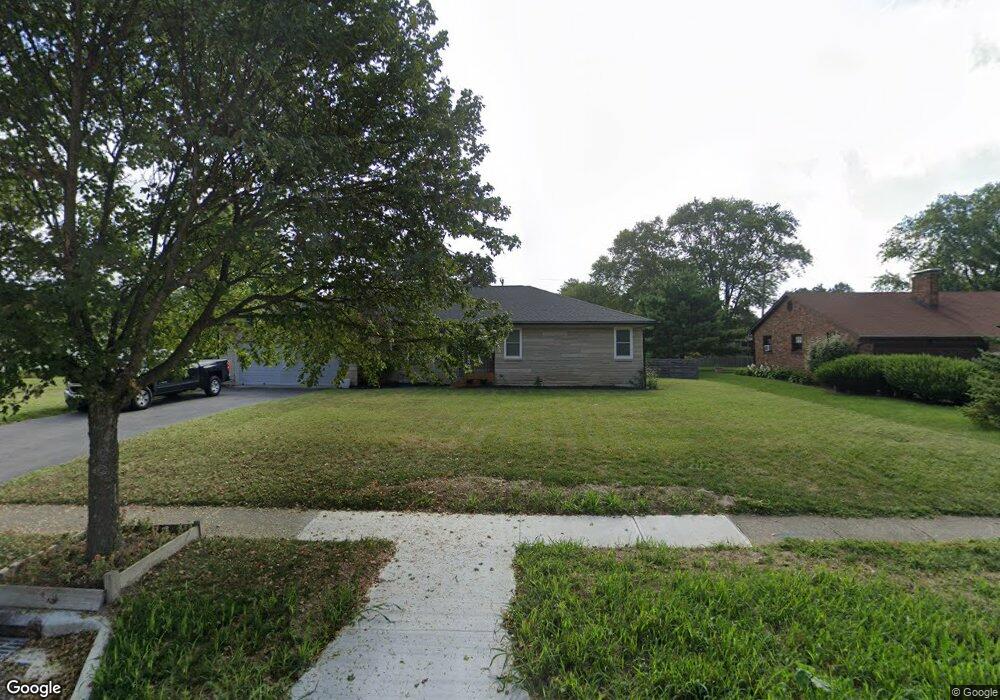
3524 Redding Rd Columbus, OH 43221
Estimated Value: $618,000 - $696,000
3
Beds
3
Baths
2,087
Sq Ft
$314/Sq Ft
Est. Value
About This Home
This home is located at 3524 Redding Rd, Columbus, OH 43221 and is currently estimated at $656,007, approximately $314 per square foot. 3524 Redding Rd is a home located in Franklin County with nearby schools including Windermere Elementary School, Hastings Middle School, and Upper Arlington High School.
Ownership History
Date
Name
Owned For
Owner Type
Purchase Details
Closed on
May 24, 2017
Sold by
Brooks Lee and Lee Jessica
Bought by
Lee Loraine and Lamb Edith
Current Estimated Value
Purchase Details
Closed on
Apr 12, 2017
Sold by
Brooks Lee Loraine and Brooks Lee Richard
Bought by
Lee Bbooks and Lee Jessica
Purchase Details
Closed on
Apr 11, 2017
Sold by
Brooks Lee Loraine and Brooks Lee Richard
Bought by
Lee Bbooks and Lee Jessica
Purchase Details
Closed on
May 16, 2016
Sold by
Brooks Lee Richard and Lee William Junior
Bought by
Lee Richard Brooks
Purchase Details
Closed on
May 4, 2016
Sold by
Brooks Lee Richard and Lee William Junior
Bought by
Lee Richard Brooks
Purchase Details
Closed on
Aug 3, 2006
Sold by
Lee Loraine and Lee William J
Bought by
Lee William J and Lee Loraine
Purchase Details
Closed on
Apr 6, 1984
Bought by
Lee Loraine
Create a Home Valuation Report for This Property
The Home Valuation Report is an in-depth analysis detailing your home's value as well as a comparison with similar homes in the area
Home Values in the Area
Average Home Value in this Area
Purchase History
| Date | Buyer | Sale Price | Title Company |
|---|---|---|---|
| Lee Loraine | -- | Ohio Title Box | |
| Lee Bbooks | $150,000 | None Available | |
| Lee Bbooks | $150,000 | None Available | |
| Lee Richard Brooks | -- | None Available | |
| Lee Richard Brooks | -- | None Available | |
| Lee William J | -- | None Available | |
| Lee Loraine | -- | -- |
Source: Public Records
Tax History
| Year | Tax Paid | Tax Assessment Tax Assessment Total Assessment is a certain percentage of the fair market value that is determined by local assessors to be the total taxable value of land and additions on the property. | Land | Improvement |
|---|---|---|---|---|
| 2025 | $10,681 | $184,490 | $65,170 | $119,320 |
| 2024 | $10,681 | $184,490 | $65,170 | $119,320 |
| 2023 | $10,548 | $184,485 | $65,170 | $119,315 |
| 2022 | $10,991 | $157,290 | $59,850 | $97,440 |
| 2021 | $9,730 | $157,290 | $59,850 | $97,440 |
| 2020 | $6,666 | $108,720 | $29,930 | $78,790 |
| 2019 | $5,964 | $86,000 | $29,930 | $56,070 |
| 2018 | $4,895 | $86,000 | $29,930 | $56,070 |
| 2017 | $4,589 | $86,000 | $29,930 | $56,070 |
| 2016 | $3,863 | $67,170 | $18,310 | $48,860 |
| 2015 | $3,859 | $67,170 | $18,310 | $48,860 |
| 2014 | $3,864 | $67,170 | $18,310 | $48,860 |
| 2013 | $1,817 | $61,040 | $16,625 | $44,415 |
Source: Public Records
Map
Nearby Homes
- 2257 Swansea Rd
- 1842 Ridgecliff Rd
- 3194 Mountview Rd
- 1763-1769 Ardleigh Rd Unit 1763-1769
- 2375 Swansea Rd
- 1744 Ridgecliff Rd Unit 12
- 3418 Sunningdale Way
- 2413 Edgevale Rd
- 3106 Somerford Rd
- 1872 Kentwell Rd Unit 1872
- 2227 Zollinger Rd
- 2480 Shrewsbury Rd
- 2458 Edgevale Rd
- 2390 Zollinger Rd
- 3900 Hillview Dr
- 3134 Asbury Dr
- 1530 Pemberton Dr
- 2200 Nayland Rd
- 2979 Avalon Rd
- 3134 Herrick Rd
- 3534 Redding Rd
- 3510 Redding Rd
- 3519 Sciotangy Dr
- 0 Sciotangy Dr
- 3546 Redding Rd
- 3500 Redding Rd
- 3535 Sciotangy Dr
- 3511 Sciotangy Dr
- 3547 Sciotangy Dr
- 3545 Redding Rd
- 3487 Sciotangy Dr
- 3557 Redding Rd
- 3488 Redding Rd
- 3501 Redding Rd
- 2003 Fishinger Rd
- 2011 Fishinger Rd
- 1991 Fishinger Rd
- 3567 Redding Rd
- 3477 Sciotangy Dr
- 3493 Redding Rd
Your Personal Tour Guide
Ask me questions while you tour the home.