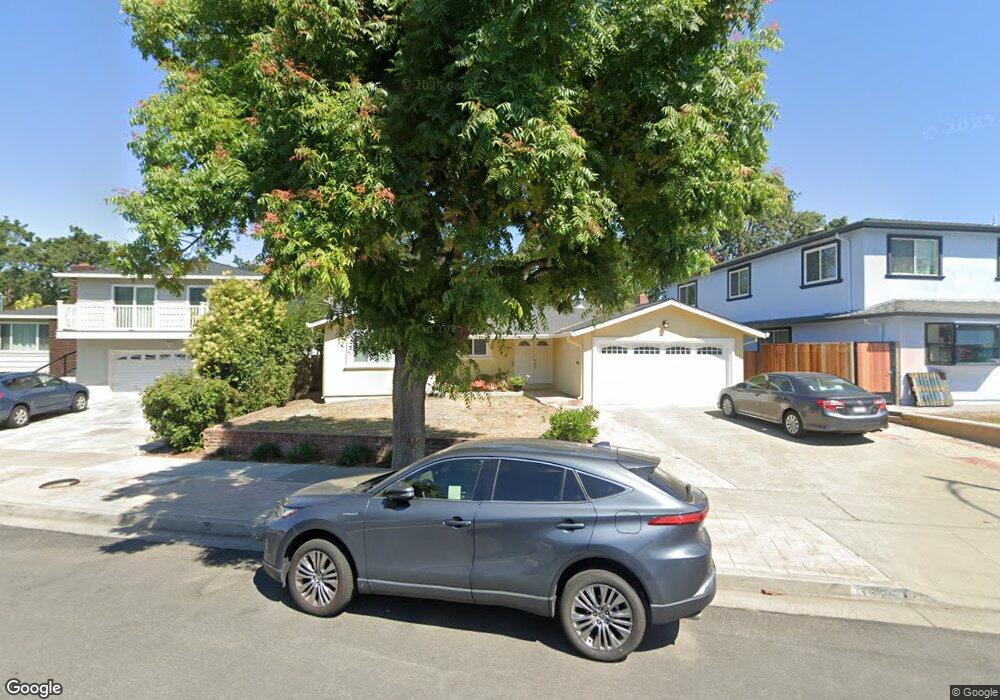
3525 Chablis Cir San Jose, CA 95132
East Foothills NeighborhoodEstimated Value: $1,513,000 - $1,595,003
4
Beds
2
Baths
1,548
Sq Ft
$1,005/Sq Ft
Est. Value
About This Home
This home is located at 3525 Chablis Cir, San Jose, CA 95132 and is currently estimated at $1,556,251, approximately $1,005 per square foot. 3525 Chablis Cir is a home located in Santa Clara County with nearby schools including Noble Elementary School, Piedmont Middle School, and Piedmont Hills High School.
Ownership History
Date
Name
Owned For
Owner Type
Purchase Details
Closed on
Sep 29, 2017
Sold by
Teng Hong Sheng and Ho Yue Mei
Bought by
Teng Hong Sheng and Ho Yue Mei Rosa
Current Estimated Value
Purchase Details
Closed on
May 1, 2009
Sold by
Wells Fargo Bank Na
Bought by
Teng Hong Sheng and Ho Yue Mei
Purchase Details
Closed on
Dec 11, 2008
Sold by
Quesada Almo and Quesada Leticia
Bought by
Wells Fargo Bank Na
Purchase Details
Closed on
Jun 15, 2005
Sold by
Kelly Robyn D
Bought by
Quesada Almo and Quesada Leticia
Home Financials for this Owner
Home Financials are based on the most recent Mortgage that was taken out on this home.
Original Mortgage
$130,000
Interest Rate
5.65%
Mortgage Type
Unknown
Purchase Details
Closed on
Jun 11, 2002
Sold by
Kelly Robyn D and Heydon Robyn D
Bought by
Kelly Robyn D
Home Financials for this Owner
Home Financials are based on the most recent Mortgage that was taken out on this home.
Original Mortgage
$207,000
Interest Rate
6.74%
Create a Home Valuation Report for This Property
The Home Valuation Report is an in-depth analysis detailing your home's value as well as a comparison with similar homes in the area
Home Values in the Area
Average Home Value in this Area
Purchase History
| Date | Buyer | Sale Price | Title Company |
|---|---|---|---|
| Teng Hong Sheng | -- | None Available | |
| Teng Hong Sheng | $465,000 | Commerce Title Company | |
| Wells Fargo Bank Na | $583,462 | Accommodation | |
| Quesada Almo | $650,000 | Old Republic Title Company | |
| Kelly Robyn D | -- | First American Title Guarant |
Source: Public Records
Mortgage History
| Date | Status | Borrower | Loan Amount |
|---|---|---|---|
| Previous Owner | Quesada Almo | $130,000 | |
| Previous Owner | Quesada Almo | $520,000 | |
| Previous Owner | Kelly Robyn D | $207,000 |
Source: Public Records
Tax History Compared to Growth
Tax History
| Year | Tax Paid | Tax Assessment Tax Assessment Total Assessment is a certain percentage of the fair market value that is determined by local assessors to be the total taxable value of land and additions on the property. | Land | Improvement |
|---|---|---|---|---|
| 2025 | $8,863 | $598,792 | $419,158 | $179,634 |
| 2024 | $8,863 | $587,052 | $410,940 | $176,112 |
| 2023 | $8,689 | $575,542 | $402,883 | $172,659 |
| 2022 | $8,638 | $564,258 | $394,984 | $169,274 |
| 2021 | $8,343 | $553,195 | $387,240 | $165,955 |
| 2020 | $8,075 | $547,524 | $383,270 | $164,254 |
| 2019 | $7,840 | $536,789 | $375,755 | $161,034 |
| 2018 | $7,722 | $526,265 | $368,388 | $157,877 |
| 2017 | $7,760 | $515,947 | $361,165 | $154,782 |
| 2016 | $7,437 | $505,832 | $354,084 | $151,748 |
| 2015 | $7,349 | $498,235 | $348,766 | $149,469 |
| 2014 | $6,638 | $488,477 | $341,935 | $146,542 |
Source: Public Records
Map
Nearby Homes
- 1103 Somerset Dr
- 3308 Whitman Way
- 1068 Ondine Ct
- 3513 Ivalynn Cir
- 1398 Vance Dr
- 15040 Penitencia Creek Rd
- 3190 Vesuvius Ln
- 1500 Hemmingway Rd
- 3425 San Pablo Ave
- 15018 San Pablo Ave
- 3092 Halgrim Ct
- 3911 Mylinda Dr
- 3972 Pepper Tree Ln
- 770 Tallent Ave
- 6 Claitor Way
- 4155 Holly Dr
- 0 Claitor Way
- 3482 Golf Dr
- 1545 Stone Creek Dr
- 3574 Sweigert Rd
- 3529 Chablis Cir
- 3521 Chablis Cir
- 3533 Chablis Cir
- 3517 Chablis Cir
- 3522 Chablis Cir
- 3526 Chablis Cir
- 3537 Chablis Cir
- 3530 Chablis Cir
- 3513 Chablis Cir
- 3507 Telegraph Dr
- 3534 Chablis Cir
- 3511 Telegraph Dr
- 3509 Chablis Cir
- 3541 Chablis Cir
- 3538 Chablis Cir
- 3515 Telegraph Dr
- 0 Chablis Cir
- 3542 Chablis Cir
- 3505 Chablis Cir
- 3527 Telegraph Dr