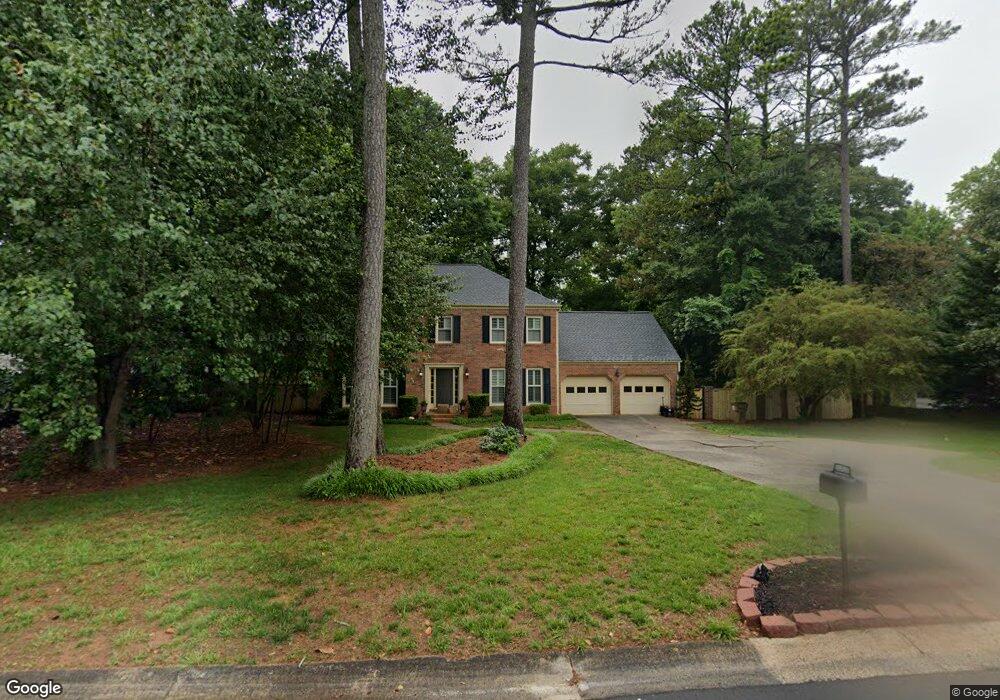
3525 Chestatee Dr Marietta, GA 30062
East Cobb NeighborhoodEstimated Value: $499,000 - $639,000
4
Beds
3
Baths
2,527
Sq Ft
$231/Sq Ft
Est. Value
About This Home
This home is located at 3525 Chestatee Dr, Marietta, GA 30062 and is currently estimated at $582,948, approximately $230 per square foot. 3525 Chestatee Dr is a home located in Cobb County with nearby schools including Shallowford Falls Elementary School, Simpson Middle School, and Lassiter High School.
Ownership History
Date
Name
Owned For
Owner Type
Purchase Details
Closed on
Jan 7, 2009
Sold by
Apple Ronald L and Apple Ryan C
Bought by
Grable Myrth A
Current Estimated Value
Home Financials for this Owner
Home Financials are based on the most recent Mortgage that was taken out on this home.
Original Mortgage
$280,502
Outstanding Balance
$178,887
Interest Rate
5.43%
Mortgage Type
Stand Alone Second
Estimated Equity
$404,061
Purchase Details
Closed on
May 8, 2008
Sold by
Us Bank Na Series 2004-3
Bought by
Apple Ronald L and Apple Ryan C
Home Financials for this Owner
Home Financials are based on the most recent Mortgage that was taken out on this home.
Original Mortgage
$164,109
Interest Rate
5.82%
Purchase Details
Closed on
Jan 2, 2008
Sold by
May Michael L and May Nancy
Bought by
U S Bank Na
Create a Home Valuation Report for This Property
The Home Valuation Report is an in-depth analysis detailing your home's value as well as a comparison with similar homes in the area
Home Values in the Area
Average Home Value in this Area
Purchase History
| Date | Buyer | Sale Price | Title Company |
|---|---|---|---|
| Grable Myrth A | $270,100 | -- | |
| Apple Ronald L | $180,000 | -- | |
| U S Bank Na | $197,189 | -- |
Source: Public Records
Mortgage History
| Date | Status | Borrower | Loan Amount |
|---|---|---|---|
| Open | Grable Myrth A | $280,502 | |
| Previous Owner | Apple Ronald L | $164,109 |
Source: Public Records
Tax History Compared to Growth
Tax History
| Year | Tax Paid | Tax Assessment Tax Assessment Total Assessment is a certain percentage of the fair market value that is determined by local assessors to be the total taxable value of land and additions on the property. | Land | Improvement |
|---|---|---|---|---|
| 2025 | $5,035 | $205,768 | $52,000 | $153,768 |
| 2024 | $4,062 | $160,744 | $36,400 | $124,344 |
| 2023 | $3,519 | $160,744 | $36,400 | $124,344 |
| 2022 | $3,274 | $123,340 | $36,400 | $86,940 |
| 2021 | $3,273 | $123,340 | $36,400 | $86,940 |
| 2020 | $3,014 | $111,468 | $23,200 | $88,268 |
| 2019 | $3,014 | $111,468 | $23,200 | $88,268 |
| 2018 | $3,014 | $111,468 | $23,200 | $88,268 |
| 2017 | $2,157 | $83,940 | $23,200 | $60,740 |
| 2016 | $2,158 | $83,940 | $23,200 | $60,740 |
| 2015 | $1,667 | $65,416 | $12,000 | $53,416 |
| 2014 | $1,681 | $65,416 | $0 | $0 |
Source: Public Records
Map
Nearby Homes
- 3605 Shallowford Rd
- 3701 Shallowford Rd
- 3333 N Hembree Rd
- 3623 Summerford Way
- 3741 Northpoint Dr
- 3968 Rock Mill Dr
- 3988 Rock Mill Dr
- 4149 Barberry Dr NE
- 3856 Fenway Crossing
- 3832 Wesley Chapel Rd
- 3447 Dry Creek Rd
- 4032 Ashmont Ct
- 3480 Pebble Hill Dr
- 3645 Lassiter Rd
- 3262 Carriage Way
- 3334 Timber Hollow Ct
- 3625 Shallowford Rd
- 3615 Shallowford Rd
- 3539 Chestatee Dr
- 3520 Chestatee Dr
- 3532 Chestatee Dr
- 3551 Chestatee Dr
- 3641 Shallowford Rd
- 3558 Chestatee Dr
- 3563 Chestatee Dr
- 3651 Shallowford Rd Unit B
- 3651 Shallowford Rd
- 3546 Wesley Chapel Rd
- 3570 Chestatee Dr
- 3566 Wesley Chapel Rd
- 3630 Shallowford Rd
- 3579 Chestatee Dr Unit 2
- 3661 Shallowford Rd
- 3576 Wesley Chapel Rd
- 3582 Chestatee Dr
- 3500 Winter Wood Dr