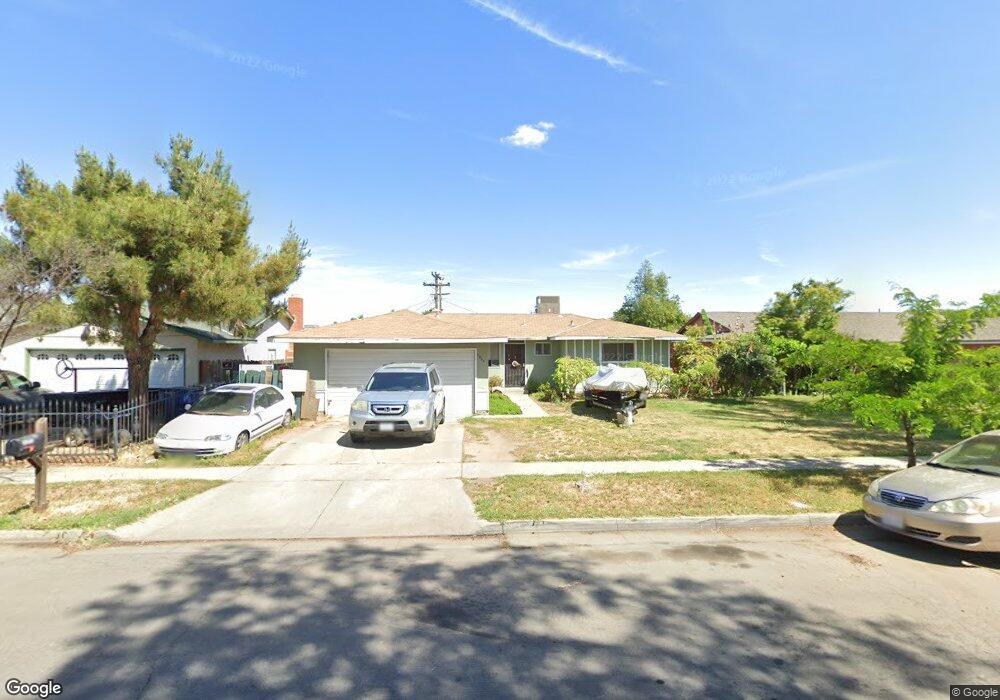
3526 N Ezie Ave Fresno, CA 93727
McLane NeighborhoodEstimated Value: $301,000 - $336,000
3
Beds
2
Baths
1,248
Sq Ft
$261/Sq Ft
Est. Value
About This Home
This home is located at 3526 N Ezie Ave, Fresno, CA 93727 and is currently estimated at $325,397, approximately $260 per square foot. 3526 N Ezie Ave is a home located in Fresno County with nearby schools including Reyburn Intermediate School, Clovis East High School, and Clovis Christian Schools.
Ownership History
Date
Name
Owned For
Owner Type
Purchase Details
Closed on
Feb 23, 2023
Sold by
Vue Xia Vang
Bought by
Vue Xia Vang and Yang Chue Fue
Current Estimated Value
Purchase Details
Closed on
Feb 26, 2018
Sold by
Vue Thai
Bought by
Vue Xia Vang and Yang Debbie Kaboa
Purchase Details
Closed on
Sep 23, 2016
Sold by
Vue Xia Vang
Bought by
Vue Thai
Purchase Details
Closed on
Apr 3, 2003
Sold by
Vue Thai and Xaochay Ntabntws
Bought by
Vue Xia Vang and Xiong Jong Sue
Home Financials for this Owner
Home Financials are based on the most recent Mortgage that was taken out on this home.
Original Mortgage
$55,000
Interest Rate
5.73%
Mortgage Type
Stand Alone First
Purchase Details
Closed on
Dec 27, 1996
Sold by
Ann Ribera Carol and Testam Ribera Norman
Bought by
Vue Thai and Xaochay Ntabntws
Home Financials for this Owner
Home Financials are based on the most recent Mortgage that was taken out on this home.
Original Mortgage
$55,100
Interest Rate
7.85%
Create a Home Valuation Report for This Property
The Home Valuation Report is an in-depth analysis detailing your home's value as well as a comparison with similar homes in the area
Home Values in the Area
Average Home Value in this Area
Purchase History
| Date | Buyer | Sale Price | Title Company |
|---|---|---|---|
| Vue Xia Vang | -- | -- | |
| Vue Xia Vang | -- | None Available | |
| Vue Thai | -- | None Available | |
| Vue Xia Vang | -- | Stewart Title Of Fresno Cnty | |
| Vue Thai | $58,000 | Central Title Company |
Source: Public Records
Mortgage History
| Date | Status | Borrower | Loan Amount |
|---|---|---|---|
| Previous Owner | Vue Xia Vang | $55,000 | |
| Previous Owner | Vue Thai | $55,100 |
Source: Public Records
Tax History Compared to Growth
Tax History
| Year | Tax Paid | Tax Assessment Tax Assessment Total Assessment is a certain percentage of the fair market value that is determined by local assessors to be the total taxable value of land and additions on the property. | Land | Improvement |
|---|---|---|---|---|
| 2025 | $2,378 | $199,034 | $56,738 | $142,296 |
| 2023 | $1,932 | $158,133 | $43,188 | $114,945 |
| 2022 | $1,906 | $155,034 | $42,342 | $112,692 |
| 2021 | $1,853 | $151,995 | $41,512 | $110,483 |
| 2020 | $1,846 | $150,438 | $41,087 | $109,351 |
| 2019 | $1,810 | $147,489 | $40,282 | $107,207 |
| 2018 | $1,771 | $144,598 | $39,493 | $105,105 |
| 2017 | $1,741 | $141,764 | $38,719 | $103,045 |
| 2016 | $1,382 | $113,827 | $33,629 | $80,198 |
| 2015 | $1,361 | $112,118 | $33,124 | $78,994 |
| 2014 | $1,336 | $109,923 | $32,476 | $77,447 |
Source: Public Records
Map
Nearby Homes
- 3322 N Ezie Ave
- 5965 E Shields Ave Unit 145
- 3550 N Duke Ave Unit 5
- 3554 N Duke Ave Unit 125
- 6030 E Dayton Ave
- 5934 E Dakota Ave
- 3556 N Duke Ave Unit 175
- 5822 E Ramona Ave
- 6083 E Andrews Ave
- 3734 Manila Ave
- 6236 E Garland Ave
- 5835 E Saginaw Way
- 3644 Manila Ave
- 5833 E Pontiac Way
- 2886 N Sophie Dr
- 2870 N Sophie Dr
- 6008 E Sussex Way
- 6338 E Ramona Way
- 1325 Griffith Ave
- 6406 E Giavanna Ave
- 3514 N Ezie Ave
- 3538 N Ezie Ave
- 5920 E Dayton Ave
- 3502 N Ezie Ave
- 5926 E Dayton Ave
- 3527 N Ezie Ave
- 3438 N Ezie Ave
- 3515 N Ezie Ave
- 3539 N Ezie Ave
- 3503 N Ezie Ave
- 5934 E Dayton Ave
- 5911 E Dayton Ave
- 5917 E Dayton Ave
- 3426 N Ezie Ave
- 5923 E Dayton Ave
- 3439 N Ezie Ave
- 5940 E Dayton Ave
- 5929 E Dayton Ave
- 3528 N Stanford Ave
- 3516 N Stanford Ave