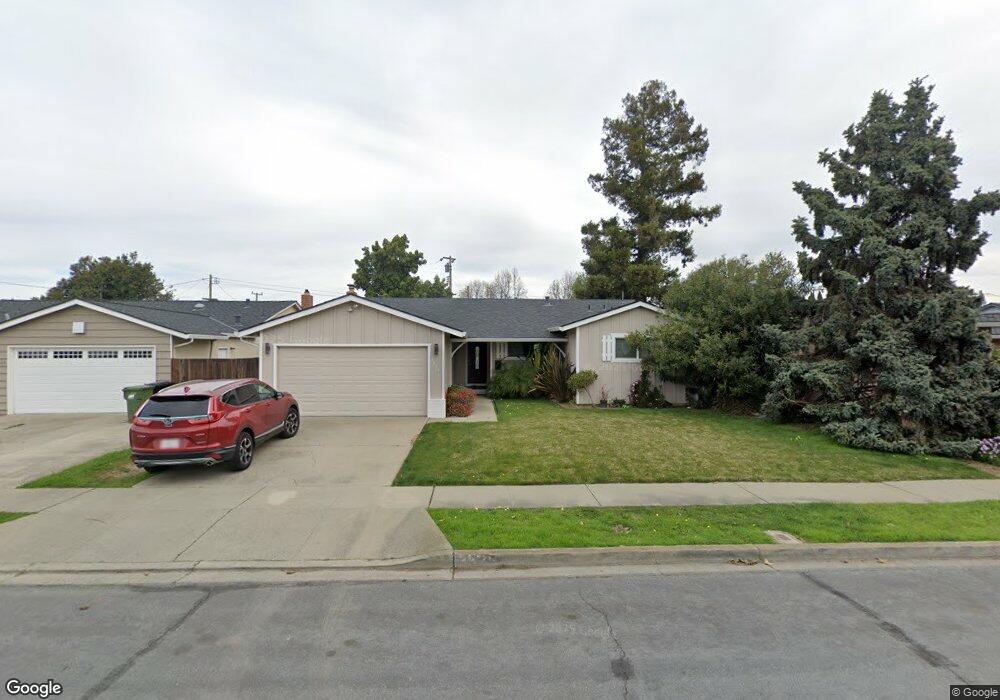
3526 Sutton Loop Fremont, CA 94536
Centerville District NeighborhoodEstimated Value: $1,513,029 - $1,746,000
3
Beds
2
Baths
1,680
Sq Ft
$980/Sq Ft
Est. Value
About This Home
This home is located at 3526 Sutton Loop, Fremont, CA 94536 and is currently estimated at $1,646,757, approximately $980 per square foot. 3526 Sutton Loop is a home located in Alameda County with nearby schools including Parkmont Elementary School, Centerville Junior High School, and Washington High School.
Ownership History
Date
Name
Owned For
Owner Type
Purchase Details
Closed on
Feb 10, 2016
Sold by
Shah Smit H and Shah Nidhi
Bought by
Shah Smit H and Shah Nidhi S
Current Estimated Value
Home Financials for this Owner
Home Financials are based on the most recent Mortgage that was taken out on this home.
Original Mortgage
$611,000
Outstanding Balance
$477,700
Interest Rate
3.37%
Mortgage Type
Adjustable Rate Mortgage/ARM
Estimated Equity
$1,169,057
Purchase Details
Closed on
Jul 25, 2013
Sold by
Cox Lynne Lewis and The Lynne Lewis Cox 2010 Revoc
Bought by
Shah Smit H and Shah Nidhi S
Home Financials for this Owner
Home Financials are based on the most recent Mortgage that was taken out on this home.
Original Mortgage
$575,960
Interest Rate
4.12%
Mortgage Type
Adjustable Rate Mortgage/ARM
Purchase Details
Closed on
Dec 27, 2010
Sold by
Cox Lynne Lewis and Cox Lynne L
Bought by
Cox Lynne Lewis and The Lynne Lewis Cox 2010 Revoc
Create a Home Valuation Report for This Property
The Home Valuation Report is an in-depth analysis detailing your home's value as well as a comparison with similar homes in the area
Home Values in the Area
Average Home Value in this Area
Purchase History
| Date | Buyer | Sale Price | Title Company |
|---|---|---|---|
| Shah Smit H | -- | Chicago Title Company | |
| Shah Smit H | $720,000 | Chicago Title Company | |
| Cox Lynne Lewis | -- | None Available |
Source: Public Records
Mortgage History
| Date | Status | Borrower | Loan Amount |
|---|---|---|---|
| Open | Shah Smit H | $611,000 | |
| Closed | Shah Smit H | $575,960 |
Source: Public Records
Tax History
| Year | Tax Paid | Tax Assessment Tax Assessment Total Assessment is a certain percentage of the fair market value that is determined by local assessors to be the total taxable value of land and additions on the property. | Land | Improvement |
|---|---|---|---|---|
| 2025 | $10,621 | $882,460 | $269,678 | $612,782 |
| 2024 | $10,621 | $865,160 | $264,391 | $600,769 |
| 2023 | $10,339 | $848,200 | $259,208 | $588,992 |
| 2022 | $10,208 | $831,570 | $254,126 | $577,444 |
| 2021 | $9,958 | $815,271 | $249,145 | $566,126 |
| 2020 | $9,991 | $806,913 | $246,591 | $560,322 |
| 2019 | $9,878 | $791,098 | $241,758 | $549,340 |
| 2018 | $9,686 | $775,591 | $237,019 | $538,572 |
| 2017 | $9,445 | $760,386 | $232,372 | $528,014 |
| 2016 | $9,286 | $745,477 | $227,816 | $517,661 |
| 2015 | $9,165 | $734,283 | $224,395 | $509,888 |
| 2014 | $9,009 | $719,900 | $220,000 | $499,900 |
Source: Public Records
Map
Nearby Homes
- 3623 Sutton Loop
- 3665 Oxford Common
- 3046 Greenwood Dr
- 3833 Burton Common
- 3810 Burton Common
- 3554 Shadowbrook Terrace
- 37856 Bright Common
- 3867 Burton Common
- 3041 Christine Ct
- 37470 Parish Cir Unit 19C
- 3291 Foxtail Terrace
- 37445 Currant Terrace
- 37434 Hazel Terrace
- 37429 Fremont Blvd
- 3232 Red Cedar Terrace Unit LU15
- 37311 Aspenwood Common Unit 203
- 3550 Buttonwood Terrace Unit 111
- 37616 Pimento Common
- 3685 Nutwood Terrace Unit 313
- 38173 Miller Place
- 3534 Sutton Loop
- 3520 Sutton Loop
- 3538 Sutton Loop
- 3326 Worthing Ct
- 3374 Worthing Ct
- 3388 Worthing Ct
- 3314 Worthing Ct
- 3396 Worthing Ct
- 3529 Sutton Loop
- 3537 Sutton Loop
- 3521 Sutton Loop
- 3542 Sutton Loop
- 3332 Worthing Ct
- 3541 Sutton Loop
- 3513 Sutton Loop
- 3307 Worthing Ct
- 3353 Alton Ct
- 3548 Sutton Loop
- 3505 Sutton Loop
- 3487 Sutton Loop
Your Personal Tour Guide
Ask me questions while you tour the home.