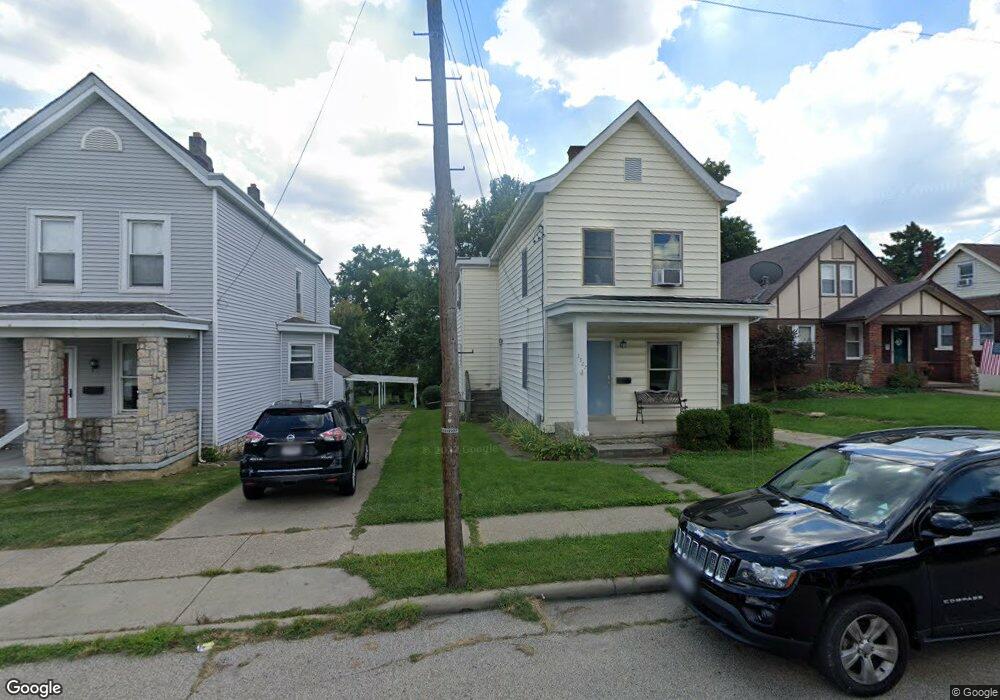
3527 Mozart Ave Cincinnati, OH 45211
Estimated Value: $217,020 - $233,000
4
Beds
2
Baths
1,948
Sq Ft
$116/Sq Ft
Est. Value
About This Home
This home is located at 3527 Mozart Ave, Cincinnati, OH 45211 and is currently estimated at $225,255, approximately $115 per square foot. 3527 Mozart Ave is a home located in Hamilton County with nearby schools including Cheviot Elementary School, Western Hills High School, and Gilbert A. Dater High School.
Ownership History
Date
Name
Owned For
Owner Type
Purchase Details
Closed on
Mar 29, 2021
Sold by
Zang Jeffrey J
Bought by
Zang Jeffrey J and Celek Deborah J
Current Estimated Value
Purchase Details
Closed on
Oct 20, 2020
Sold by
Zang Mary L and Zang Joseph O
Bought by
Zang Jeffrey J and Zang Sandra J
Purchase Details
Closed on
Dec 8, 2018
Sold by
Daugherty Carol and Daugherty Gregory
Bought by
Zang Mary L and Zang Jeffrey J
Purchase Details
Closed on
Jun 19, 2004
Sold by
Daugherty Gregory and Daugherty Carol
Bought by
Daugherty Carol and Zang Jeffrey J
Purchase Details
Closed on
Aug 9, 1999
Sold by
Zang Mary L
Bought by
Daughtery Gregory and Daughtery Carol
Home Financials for this Owner
Home Financials are based on the most recent Mortgage that was taken out on this home.
Original Mortgage
$50,125
Interest Rate
8.21%
Create a Home Valuation Report for This Property
The Home Valuation Report is an in-depth analysis detailing your home's value as well as a comparison with similar homes in the area
Home Values in the Area
Average Home Value in this Area
Purchase History
| Date | Buyer | Sale Price | Title Company |
|---|---|---|---|
| Zang Jeffrey J | -- | None Available | |
| Zang Jeffrey J | -- | None Available | |
| Zang Mary L | -- | None Available | |
| Daugherty Carol | $46,300 | -- | |
| Daughtery Gregory | -- | -- |
Source: Public Records
Mortgage History
| Date | Status | Borrower | Loan Amount |
|---|---|---|---|
| Previous Owner | Daughtery Gregory | $50,125 |
Source: Public Records
Tax History Compared to Growth
Tax History
| Year | Tax Paid | Tax Assessment Tax Assessment Total Assessment is a certain percentage of the fair market value that is determined by local assessors to be the total taxable value of land and additions on the property. | Land | Improvement |
|---|---|---|---|---|
| 2024 | $3,292 | $51,492 | $7,434 | $44,058 |
| 2023 | $3,297 | $51,492 | $7,434 | $44,058 |
| 2022 | $2,533 | $34,287 | $6,437 | $27,850 |
| 2021 | $2,520 | $34,287 | $6,437 | $27,850 |
| 2020 | $2,494 | $34,287 | $6,437 | $27,850 |
| 2019 | $2,466 | $30,342 | $5,695 | $24,647 |
| 2018 | $2,387 | $30,342 | $5,695 | $24,647 |
| 2017 | $2,281 | $30,342 | $5,695 | $24,647 |
| 2016 | $2,302 | $30,048 | $5,866 | $24,182 |
| 2015 | $2,091 | $30,048 | $5,866 | $24,182 |
| 2014 | $2,044 | $30,048 | $5,866 | $24,182 |
| 2013 | $2,012 | $29,173 | $5,695 | $23,478 |
Source: Public Records
Map
Nearby Homes
- 3519 Mozart Ave
- 3613 Everett Ave
- 3415 Gamble Ave
- 3418 Gamble Ave
- 3636 Herbert Ave
- 3846 Davis Ave
- 3836 N Bend Rd
- 3842 Delmar Ave
- 3433 Miami Ct
- 3832 Meyerfeld Ave
- 3699 Lovell Ave
- 3549 Meadow Ave
- 3637 Woodbine Ave
- 3502 Woodbine Ave
- 3498 Boudinot Ave
- 3292 Montana Ave
- 3832 Lovell Ave
- 3424 Craig Ave
- 3707 Wilmar Dr
- 3719 Wilmar Dr
- 3535 Mozart Ave
- 3523 Mozart Ave
- 3539 Mozart Ave
- 3515 Mozart Ave
- 3534 Mozart Ave
- 3543 Mozart Ave
- 3520 Mozart Ave
- 3536 Mozart Ave
- 3704 Cross St
- 3708 Cross St
- 3540 Mozart Ave
- 3512 Mozart Ave
- 3629 Mozart Ave
- 3710 Cross St
- 3531 Gamble Ave
- 3533 Gamble Ave
- 3510 Mozart Ave
- 3505 Mozart Ave
- 3520 Saint Martins Place
- 3518 Saint Martins Place