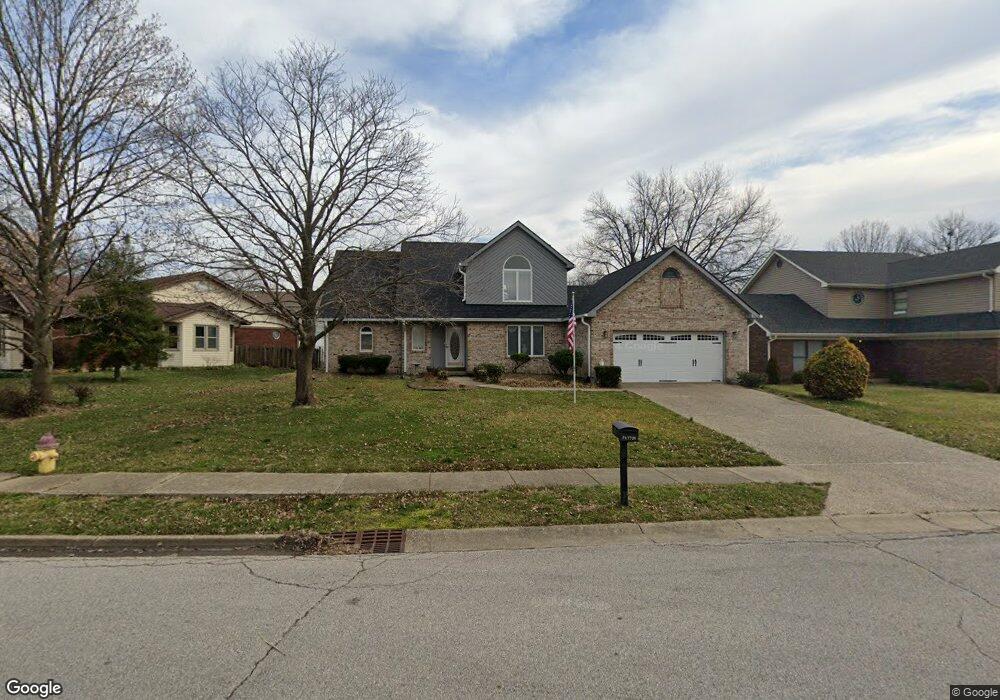
3528 Sundance Dr New Albany, IN 47150
Estimated Value: $304,000 - $414,000
3
Beds
2
Baths
1,883
Sq Ft
$185/Sq Ft
Est. Value
About This Home
This home is located at 3528 Sundance Dr, New Albany, IN 47150 and is currently estimated at $349,135, approximately $185 per square foot. 3528 Sundance Dr is a home located in Floyd County with nearby schools including Grant Line School, Nathaniel Scribner Middle School, and New Albany Senior High School.
Ownership History
Date
Name
Owned For
Owner Type
Purchase Details
Closed on
Jun 8, 2022
Sold by
Payton Linda K
Bought by
Payton Bryan Keith
Current Estimated Value
Purchase Details
Closed on
Feb 28, 2020
Sold by
Shofner William and Shofner Brenda
Bought by
Payton Wendell and Payton Linda
Purchase Details
Closed on
Sep 27, 2019
Sold by
Shively Walter and Shively Ann H
Bought by
Shofner William and Shofner Brenda
Purchase Details
Closed on
Aug 30, 2007
Sold by
Kost Howard Nelson and Kost Mary Ann
Bought by
Shively Walter B and Shively Ann H
Home Financials for this Owner
Home Financials are based on the most recent Mortgage that was taken out on this home.
Original Mortgage
$100,000
Interest Rate
6.55%
Mortgage Type
New Conventional
Create a Home Valuation Report for This Property
The Home Valuation Report is an in-depth analysis detailing your home's value as well as a comparison with similar homes in the area
Home Values in the Area
Average Home Value in this Area
Purchase History
| Date | Buyer | Sale Price | Title Company |
|---|---|---|---|
| Payton Bryan Keith | -- | Lorch Naville Ward Llc | |
| Payton Wendell | -- | None Available | |
| Shofner William | -- | None Available | |
| Shively Walter B | $195,900 | None Available |
Source: Public Records
Mortgage History
| Date | Status | Borrower | Loan Amount |
|---|---|---|---|
| Previous Owner | Shively Walter B | $100,000 |
Source: Public Records
Tax History Compared to Growth
Tax History
| Year | Tax Paid | Tax Assessment Tax Assessment Total Assessment is a certain percentage of the fair market value that is determined by local assessors to be the total taxable value of land and additions on the property. | Land | Improvement |
|---|---|---|---|---|
| 2024 | $2,156 | $271,200 | $27,200 | $244,000 |
| 2023 | $1,856 | $249,200 | $27,200 | $222,000 |
| 2022 | $1,937 | $243,900 | $27,200 | $216,700 |
| 2021 | $1,812 | $231,500 | $27,200 | $204,300 |
| 2020 | $1,791 | $231,500 | $27,200 | $204,300 |
| 2019 | $1,560 | $212,500 | $27,200 | $185,300 |
| 2018 | $1,627 | $222,100 | $27,200 | $194,900 |
| 2017 | $1,436 | $189,500 | $27,200 | $162,300 |
| 2016 | $1,411 | $199,100 | $27,200 | $171,900 |
| 2014 | $1,192 | $164,000 | $27,100 | $136,900 |
| 2013 | -- | $159,600 | $27,200 | $132,400 |
Source: Public Records
Map
Nearby Homes
- 4105 Stone Place
- 3810 Wayne St
- 3617 Doe Run Way
- 3807 Homestead Dr
- BERKSHIRE Plan at Jefferson Gardens
- AUBURN Plan at Jefferson Gardens
- 4722 Timber Pine Dr Unit 99
- 4724 Timber Pine Dr Unit 100
- 4724 Black Pine Blvd Unit 73
- 1130 Eastridge Dr
- 3941 Carver St
- 4834 Ashbury Dr
- 3920 Windsor Creek Dr
- 3517 Kamer Miller Rd
- 3903 Rainbow Dr
- 30 Doebrook Ct
- 3021 Grace Marie Way
- Elm Plan at Koehler Woods
- Downing Plan at Koehler Woods
- PINE Plan at Koehler Woods
- 3606 Sundance Dr
- 3526 Sundance Dr
- 3605 Greenfield Dr
- 3603 Greenfield Dr
- 3607 Greenfield Dr
- 3601 Greenfield Dr
- 3609 Greenfield Dr
- 3535 Sundance Dr
- 3607 Sundance Dr
- 3610 Sundance Dr
- 3533 Sundance Dr
- 113 Mack Dr
- 3611 Greenfield Dr
- 3531 Sundance Dr
- 201 Crescent Loop
- 3529 Sundance Dr
- 3606 Greenfield Dr
- 204 Mcconnell Dr
- 202 Crescent Loop
- 3613 Greenfield Dr