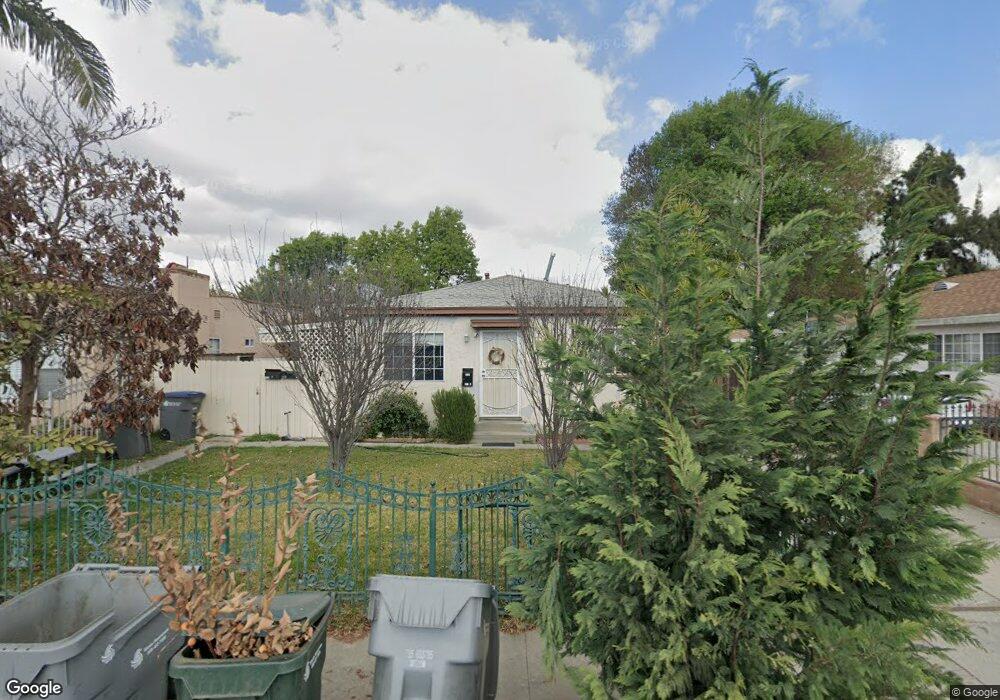
3529 Agnes St Lynwood, CA 90262
Estimated Value: $807,000 - $1,004,000
3
Beds
3
Baths
1,800
Sq Ft
$489/Sq Ft
Est. Value
About This Home
This home is located at 3529 Agnes St, Lynwood, CA 90262 and is currently estimated at $879,542, approximately $488 per square foot. 3529 Agnes St is a home located in Los Angeles County with nearby schools including Rosa Parks Elementary School, Lynwood Middle School, and Marco Antonio Firebaugh High School.
Ownership History
Date
Name
Owned For
Owner Type
Purchase Details
Closed on
Jan 24, 2000
Sold by
Sazmand Azizallah
Bought by
Garcia Gustavo and Garcia Silvano
Current Estimated Value
Purchase Details
Closed on
Sep 21, 1999
Sold by
Sazmand Aziz
Bought by
Sazmand Azizallah
Purchase Details
Closed on
Sep 7, 1999
Sold by
Mancilla Oscar A
Bought by
Sazmand Aziz
Purchase Details
Closed on
Aug 24, 1998
Sold by
Federal Home Loan Mortgage Corporation
Bought by
Mancilla Oscar A
Home Financials for this Owner
Home Financials are based on the most recent Mortgage that was taken out on this home.
Original Mortgage
$123,000
Interest Rate
6.92%
Purchase Details
Closed on
Jul 6, 1998
Sold by
Alcala Jose T and Alcala Maria O
Bought by
Federal Home Loan Mortgage Corporation
Home Financials for this Owner
Home Financials are based on the most recent Mortgage that was taken out on this home.
Original Mortgage
$123,000
Interest Rate
6.92%
Create a Home Valuation Report for This Property
The Home Valuation Report is an in-depth analysis detailing your home's value as well as a comparison with similar homes in the area
Home Values in the Area
Average Home Value in this Area
Purchase History
| Date | Buyer | Sale Price | Title Company |
|---|---|---|---|
| Garcia Gustavo | $200,000 | -- | |
| Sazmand Azizallah | -- | First American Title Ins Co | |
| Sazmand Aziz | -- | -- | |
| Mancilla Oscar A | $131,818 | First American Title | |
| Federal Home Loan Mortgage Corporation | $135,000 | American Title Co |
Source: Public Records
Mortgage History
| Date | Status | Borrower | Loan Amount |
|---|---|---|---|
| Previous Owner | Mancilla Oscar A | $123,000 |
Source: Public Records
Tax History Compared to Growth
Tax History
| Year | Tax Paid | Tax Assessment Tax Assessment Total Assessment is a certain percentage of the fair market value that is determined by local assessors to be the total taxable value of land and additions on the property. | Land | Improvement |
|---|---|---|---|---|
| 2025 | $4,984 | $312,503 | $122,947 | $189,556 |
| 2024 | $4,984 | $306,377 | $120,537 | $185,840 |
| 2023 | $4,948 | $300,371 | $118,174 | $182,197 |
| 2022 | $4,783 | $294,482 | $115,857 | $178,625 |
| 2021 | $4,616 | $288,709 | $113,586 | $175,123 |
| 2019 | $4,711 | $280,148 | $110,218 | $169,930 |
| 2018 | $4,289 | $274,656 | $108,057 | $166,599 |
| 2016 | $4,003 | $263,993 | $103,862 | $160,131 |
| 2015 | $3,925 | $260,028 | $102,302 | $157,726 |
| 2014 | $3,853 | $254,936 | $100,299 | $154,637 |
Source: Public Records
Map
Nearby Homes
- 3617 Cedar Ave
- 3370 Josephine St
- 3685 Fernwood Ave
- 3276 Cedar Ave
- 11464 Copeland St
- 11460 Copeland St
- 3226 Palm Ave
- 3234 Cedar Ave
- 3644 Platt Ave
- 3805 Lugo Ave
- 3955 Agnes Ave
- 3886 Cortland St
- 12434 Peach St Unit A-B
- 11952 Santa fe Ave
- 1010 E Stockton Ave
- 3831 Walnut Ave
- 921 E Pine St
- 3130 Euclid Ave
- 536 E El Segundo Blvd
- 12120 Muriel Dr
- 3525 Agnes St
- 3535 Agnes St
- 11923 School St
- 11919 School St
- 3519 Agnes St
- 3539 Agnes St
- 3544 Virginia St
- 3540 Virginia St
- 3550 Virginia St
- 3534 Agnes St
- 3534 Virginia St Unit B
- 3554 Virginia St
- 3601 Agnes Ave
- 3528 Agnes St
- 3540 Agnes St
- 3516 Agnes St
- 3522 Agnes St
- 3530 Virginia St
- 3600 Virginia St
- 3607 Agnes Ave