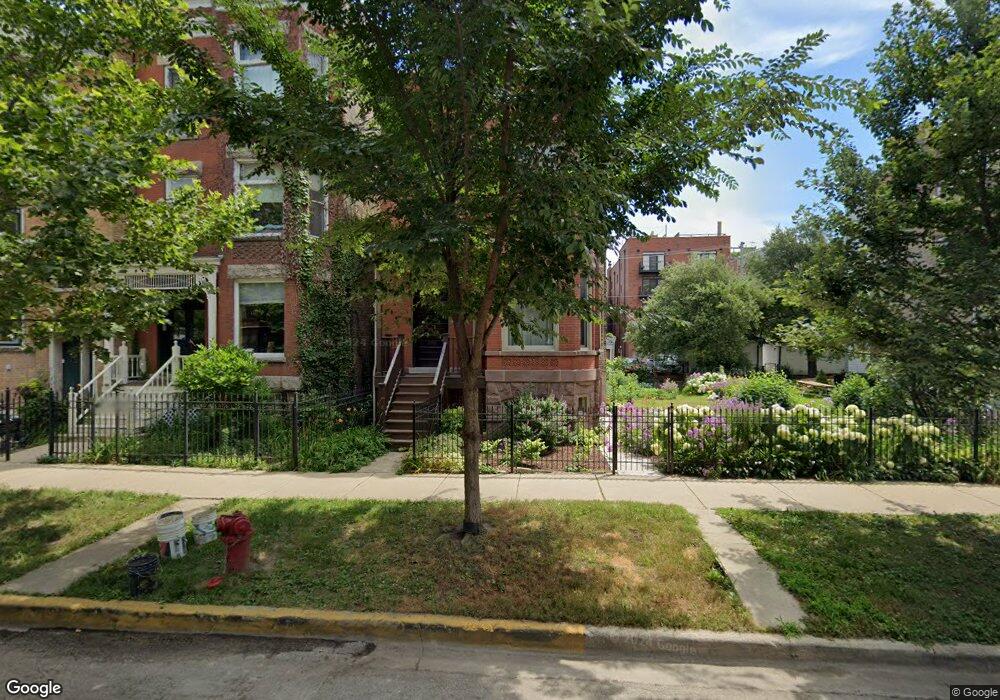
3529 N Fremont St Unit 202 Chicago, IL 60657
Lakeview East NeighborhoodEstimated Value: $1,044,000 - $2,427,000
4
Beds
4
Baths
2,114
Sq Ft
$730/Sq Ft
Est. Value
About This Home
This home is located at 3529 N Fremont St Unit 202, Chicago, IL 60657 and is currently estimated at $1,543,896, approximately $730 per square foot. 3529 N Fremont St Unit 202 is a home located in Cook County with nearby schools including Nettelhorst Elementary School, Lake View High School, and Bernard Zell Anshe Emet Day School.
Ownership History
Date
Name
Owned For
Owner Type
Purchase Details
Closed on
Nov 12, 2009
Sold by
Carlson Carolyn
Bought by
Deakins Christopher W and Bose Deakins Jillayne E
Current Estimated Value
Purchase Details
Closed on
Nov 18, 2008
Sold by
Ruckstuhl Robert M and Ruckstuhl Robert
Bought by
Ruckstuhl Robert M and Robert M Ruckstuhl Trust
Create a Home Valuation Report for This Property
The Home Valuation Report is an in-depth analysis detailing your home's value as well as a comparison with similar homes in the area
Home Values in the Area
Average Home Value in this Area
Purchase History
| Date | Buyer | Sale Price | Title Company |
|---|---|---|---|
| Deakins Christopher W | -- | None Available | |
| Ruckstuhl Robert M | -- | None Available |
Source: Public Records
Tax History Compared to Growth
Tax History
| Year | Tax Paid | Tax Assessment Tax Assessment Total Assessment is a certain percentage of the fair market value that is determined by local assessors to be the total taxable value of land and additions on the property. | Land | Improvement |
|---|---|---|---|---|
| 2024 | $31,449 | $126,000 | $63,000 | $63,000 |
| 2023 | $30,637 | $152,371 | $93,750 | $58,621 |
| 2022 | $30,637 | $152,371 | $93,750 | $58,621 |
| 2021 | $29,971 | $152,371 | $93,750 | $58,621 |
| 2020 | $23,121 | $106,893 | $40,000 | $66,893 |
| 2019 | $22,655 | $116,189 | $40,000 | $76,189 |
| 2018 | $22,273 | $116,189 | $40,000 | $76,189 |
| 2017 | $15,724 | $76,417 | $35,000 | $41,417 |
| 2016 | $14,805 | $76,417 | $35,000 | $41,417 |
| 2015 | $13,522 | $76,417 | $35,000 | $41,417 |
| 2014 | $12,557 | $70,249 | $28,750 | $41,499 |
| 2013 | $12,298 | $70,249 | $28,750 | $41,499 |
Source: Public Records
Map
Nearby Homes
- 3509 N Fremont St Unit 3
- 854 W Cornelia Ave Unit 302
- 3508 N Reta Ave Unit 201
- 3507 N Reta Ave Unit 3
- 3541 N Wilton Ave Unit 2
- 903 W Cornelia Ave Unit 1N
- 902 W Newport Ave
- 3519 N Sheffield Ave Unit 2N
- 862 W Roscoe St Unit 1
- 902 W Roscoe St Unit 4
- 912 W Roscoe St Unit 1
- 3635 N Wilton Ave Unit 4
- 718 W Cornelia Ave
- 3430 N Elaine Place Unit 3
- 1014 W Roscoe St Unit OP-
- 835 W Buckingham Place Unit 2
- 3335 N Sheffield Ave
- 3723 N Wilton Ave Unit 4
- 625 W Addison St Unit 3
- 3351 N Seminary Ave Unit 3S
- 3531 N Fremont St Unit 1
- 3531 N Fremont St Unit 2
- 3533 N Fremont St
- 3533 N Fremont St Unit 3
- 3533 N Fremont St Unit 2
- 3521 N Fremont St Unit 2
- 3535 N Fremont St Unit 2
- 3535 N Fremont St Unit 3
- 3535 N Fremont St Unit 1
- 3539 N Fremont St Unit 3
- 3539 N Fremont St Unit 35393
- 3539 N Fremont St Unit 35391
- 3539 N Fremont St Unit 35392
- 3539 N Fremont St Unit 1
- 3519 N Fremont St Unit 4
- 3519 N Fremont St Unit 1
- 3519 N Fremont St Unit 3
- 3519 N Fremont St Unit 2
- 3544 N Fremont St Unit 4S
- 3544 N Fremont St Unit 1S