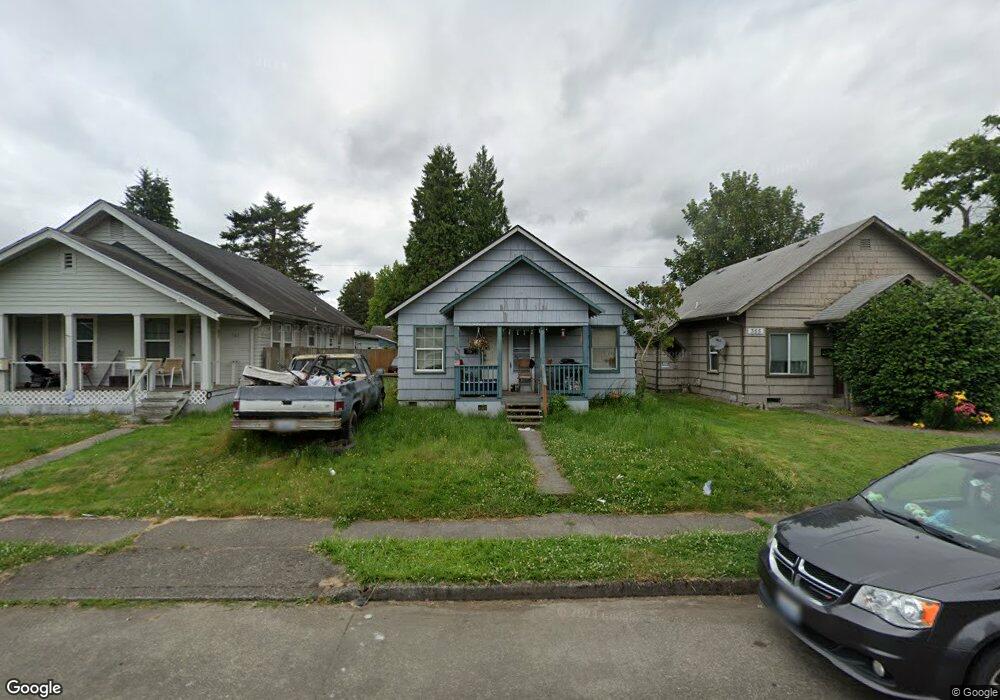
353 24th Ave Longview, WA 98632
Highlands NeighborhoodEstimated Value: $232,041 - $281,000
2
Beds
1
Bath
624
Sq Ft
$403/Sq Ft
Est. Value
About This Home
This home is located at 353 24th Ave, Longview, WA 98632 and is currently estimated at $251,760, approximately $403 per square foot. 353 24th Ave is a home located in Cowlitz County with nearby schools including Monticello Middle School, R.A. Long High School, and St. Rose School.
Ownership History
Date
Name
Owned For
Owner Type
Purchase Details
Closed on
Mar 10, 2016
Sold by
Wolden David C and Wolden Tamara D
Bought by
Wolden Nicholas D and Wolden Adrian
Current Estimated Value
Home Financials for this Owner
Home Financials are based on the most recent Mortgage that was taken out on this home.
Original Mortgage
$40,000
Interest Rate
3.79%
Mortgage Type
Seller Take Back
Purchase Details
Closed on
Dec 1, 2015
Sold by
Larson William Robert
Bought by
Wolden David and Wolden Tamara
Purchase Details
Closed on
Nov 20, 2006
Sold by
Crisifulli Kara K
Bought by
Mcbride Francis E
Home Financials for this Owner
Home Financials are based on the most recent Mortgage that was taken out on this home.
Original Mortgage
$31,052
Interest Rate
6.33%
Mortgage Type
Purchase Money Mortgage
Create a Home Valuation Report for This Property
The Home Valuation Report is an in-depth analysis detailing your home's value as well as a comparison with similar homes in the area
Home Values in the Area
Average Home Value in this Area
Purchase History
| Date | Buyer | Sale Price | Title Company |
|---|---|---|---|
| Wolden Nicholas D | $46,500 | None Available | |
| Wolden David | -- | None Available | |
| Mcbride Francis E | -- | None Available |
Source: Public Records
Mortgage History
| Date | Status | Borrower | Loan Amount |
|---|---|---|---|
| Previous Owner | Wolden Nicholas D | $40,000 | |
| Previous Owner | Mcbride Francis E | $31,052 |
Source: Public Records
Tax History
| Year | Tax Paid | Tax Assessment Tax Assessment Total Assessment is a certain percentage of the fair market value that is determined by local assessors to be the total taxable value of land and additions on the property. | Land | Improvement |
|---|---|---|---|---|
| 2024 | $1,845 | $212,220 | $21,500 | $190,720 |
| 2023 | $1,639 | $188,920 | $21,500 | $167,420 |
| 2022 | $1,500 | $169,660 | $21,500 | $148,160 |
| 2021 | $1,354 | $150,330 | $21,500 | $128,830 |
| 2020 | $1,027 | $122,150 | $21,500 | $100,650 |
| 2019 | $919 | $97,061 | $16,538 | $80,523 |
| 2018 | $679 | $84,780 | $16,540 | $68,240 |
| 2017 | $619 | $51,320 | $15,750 | $35,570 |
| 2016 | $593 | $47,760 | $15,000 | $32,760 |
| 2015 | $645 | $46,850 | $15,000 | $31,850 |
| 2013 | -- | $46,990 | $15,000 | $31,990 |
Source: Public Records
Map
Nearby Homes
Your Personal Tour Guide
Ask me questions while you tour the home.