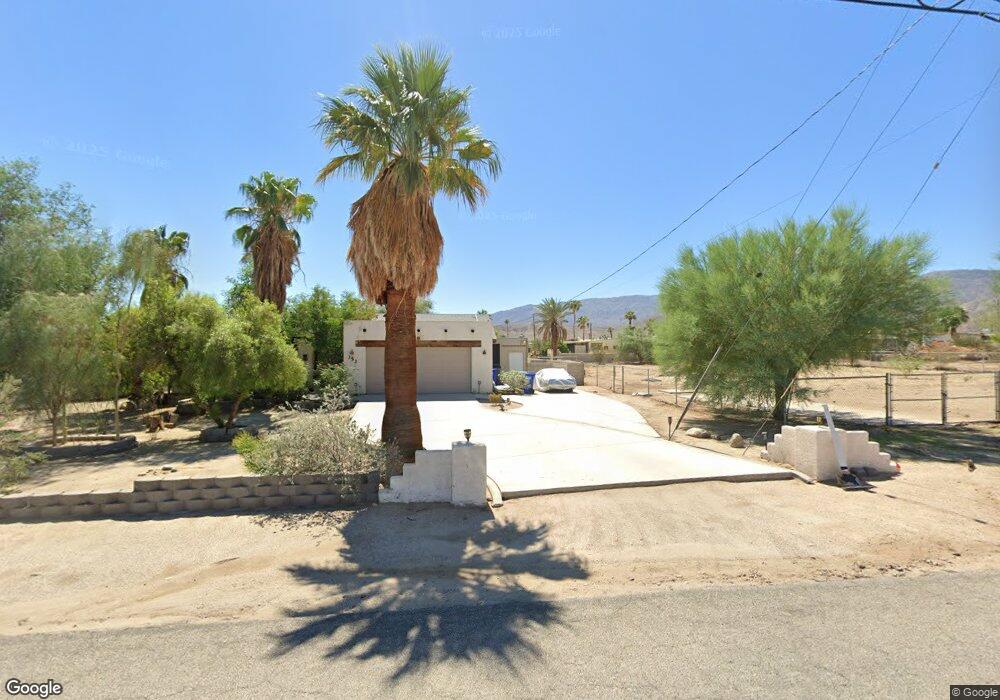
353 Arbalest Dr Borrego Springs, CA 92004
Estimated Value: $355,000 - $457,000
3
Beds
2
Baths
1,352
Sq Ft
$294/Sq Ft
Est. Value
About This Home
This home is located at 353 Arbalest Dr, Borrego Springs, CA 92004 and is currently estimated at $397,684, approximately $294 per square foot. 353 Arbalest Dr is a home with nearby schools including Borrego Springs Elementary School, Borrego Springs Middle School, and Borrego Springs High School.
Ownership History
Date
Name
Owned For
Owner Type
Purchase Details
Closed on
Feb 27, 2023
Sold by
Paredes Catherine A
Bought by
Catherine A Paredes Family Trust
Current Estimated Value
Purchase Details
Closed on
Aug 26, 2002
Sold by
Paredes Catherine
Bought by
Paredes Catherine
Home Financials for this Owner
Home Financials are based on the most recent Mortgage that was taken out on this home.
Original Mortgage
$130,000
Interest Rate
6.05%
Purchase Details
Closed on
Dec 21, 2000
Sold by
Paredes Joseph
Bought by
Paredes Catherine
Purchase Details
Closed on
Sep 2, 1997
Sold by
Salvin William T and Salvin Lisa A
Bought by
Paredes Joseph P and Paredes Catherine A
Home Financials for this Owner
Home Financials are based on the most recent Mortgage that was taken out on this home.
Original Mortgage
$125,100
Interest Rate
7.54%
Purchase Details
Closed on
Dec 18, 1992
Purchase Details
Closed on
Sep 11, 1990
Create a Home Valuation Report for This Property
The Home Valuation Report is an in-depth analysis detailing your home's value as well as a comparison with similar homes in the area
Home Values in the Area
Average Home Value in this Area
Purchase History
| Date | Buyer | Sale Price | Title Company |
|---|---|---|---|
| Catherine A Paredes Family Trust | -- | -- | |
| Paredes Catherine | -- | Old Republic Title Company | |
| Paredes Catherine | -- | -- | |
| Paredes Joseph P | $139,000 | South Coast Title Company | |
| -- | $95,000 | -- | |
| -- | $10,000 | -- |
Source: Public Records
Mortgage History
| Date | Status | Borrower | Loan Amount |
|---|---|---|---|
| Previous Owner | Paredes Catherine | $130,000 | |
| Previous Owner | Paredes Joseph P | $125,100 |
Source: Public Records
Tax History Compared to Growth
Tax History
| Year | Tax Paid | Tax Assessment Tax Assessment Total Assessment is a certain percentage of the fair market value that is determined by local assessors to be the total taxable value of land and additions on the property. | Land | Improvement |
|---|---|---|---|---|
| 2025 | $2,360 | $221,924 | $39,905 | $182,019 |
| 2024 | $2,360 | $217,573 | $39,123 | $178,450 |
| 2023 | $2,310 | $213,307 | $38,356 | $174,951 |
| 2022 | $2,275 | $209,125 | $37,604 | $171,521 |
| 2021 | $2,234 | $205,025 | $36,867 | $168,158 |
| 2020 | $2,227 | $202,923 | $36,489 | $166,434 |
| 2019 | $2,072 | $198,945 | $35,774 | $163,171 |
| 2018 | $2,030 | $195,045 | $35,073 | $159,972 |
| 2017 | $1,990 | $191,222 | $34,386 | $156,836 |
| 2016 | $1,944 | $187,473 | $33,712 | $153,761 |
| 2015 | $1,916 | $184,658 | $33,206 | $151,452 |
| 2014 | $1,871 | $181,042 | $32,556 | $148,486 |
Source: Public Records
Map
Nearby Homes
- 2 Hauberk Dr
- 2 Lazy Dr S
- 1 Lazy Dr S
- 0 Lazy S Unit NDP2402705
- 0 Verbena Dr Unit IV25127409
- 2039 Lazy Dr S
- 1 Laramie St
- 341 Ocotillo Cir
- 406 Santa fe Trail
- 373 Ocotillo Cir
- 347 Wheel Hub Place
- 202 Pointing Rock Dr Unit 19
- 202 Pointing Rock Dr Unit 15
- 196 Montezuma Rd
- 2490 Hoberg Rd
- 1682 Montezuma Ct Unit 13
- 468 Palm Canyon Dr
- 119 Montezuma Rd
- 351 Palm Canyon Dr Unit 64
- 581 Catarina Dr
- 115 Arbalest Dr
- Lot 114 Arbalest
- Lot 114 Arbalest Unit 114
- 0 Onager Dr Unit NDP2211543
- 0 Onager Dr Unit 200022087
- 0 Onager Dr Unit 180067936
- 342 Onager Dr
- 1991 Hauberk Dr
- 332 Onager Dr
- 0000 Onager Dr
- 320 Onager Dr
- Lot 132 Onager Dr
- Lot 132 Onager Dr Unit 132
- 133 Mangonel Dr
- 0 Mangonel Dr Unit 152 140005780
- 0 Mangonel Dr Unit 200022089
- 2001 Mangonel Dr
- 330 Arbalest Dr
- 1976 Fenoval Dr
- 393 Arbalest Dr