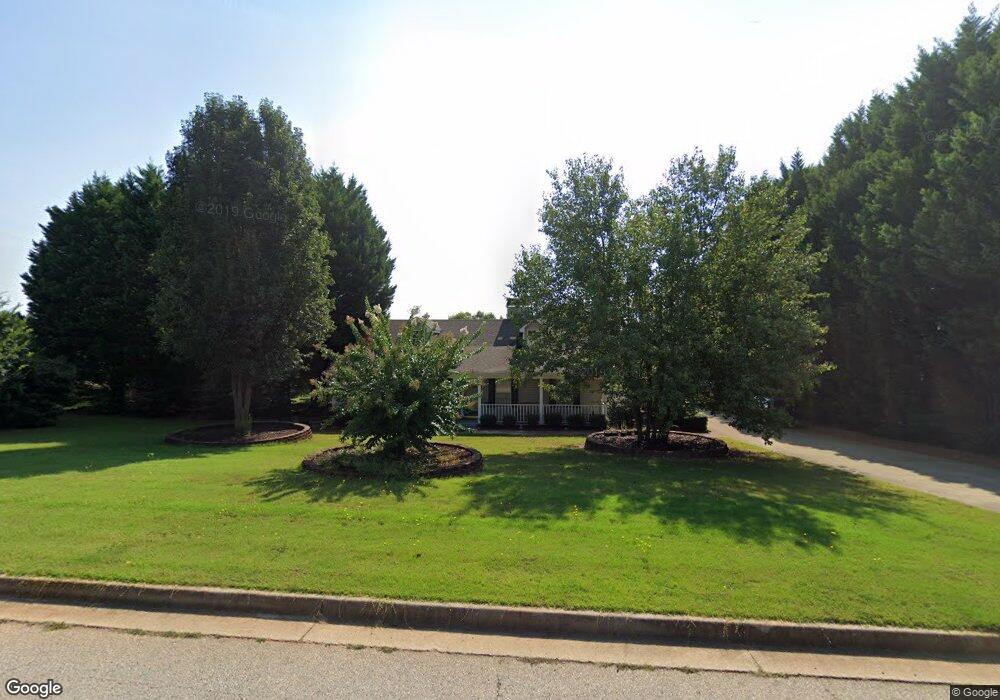
353 Cattlemans Cir McDonough, GA 30252
Estimated Value: $295,318 - $315,000
3
Beds
2
Baths
1,979
Sq Ft
$155/Sq Ft
Est. Value
About This Home
This home is located at 353 Cattlemans Cir, McDonough, GA 30252 and is currently estimated at $305,830, approximately $154 per square foot. 353 Cattlemans Cir is a home located in Henry County with nearby schools including New Hope Elementary School, Locust Grove Middle School, and Locust Grove High School.
Ownership History
Date
Name
Owned For
Owner Type
Purchase Details
Closed on
Apr 29, 2016
Sold by
Yarborough Paul M
Bought by
Bliss Robert C and Bliss Joyce M
Current Estimated Value
Home Financials for this Owner
Home Financials are based on the most recent Mortgage that was taken out on this home.
Original Mortgage
$154,846
Outstanding Balance
$123,137
Interest Rate
3.71%
Mortgage Type
VA
Estimated Equity
$182,693
Purchase Details
Closed on
Dec 22, 1999
Sold by
Joe Chandler Const Inc
Bought by
Yarbrough Paul M
Home Financials for this Owner
Home Financials are based on the most recent Mortgage that was taken out on this home.
Original Mortgage
$104,500
Interest Rate
7.8%
Mortgage Type
New Conventional
Purchase Details
Closed on
Apr 30, 1999
Sold by
John Hawkins Const Inc
Bought by
Lewis Hugh L
Home Financials for this Owner
Home Financials are based on the most recent Mortgage that was taken out on this home.
Original Mortgage
$80,000
Interest Rate
7.31%
Mortgage Type
New Conventional
Create a Home Valuation Report for This Property
The Home Valuation Report is an in-depth analysis detailing your home's value as well as a comparison with similar homes in the area
Home Values in the Area
Average Home Value in this Area
Purchase History
| Date | Buyer | Sale Price | Title Company |
|---|---|---|---|
| Bliss Robert C | $149,900 | -- | |
| Yarbrough Paul M | $109,000 | -- | |
| Lewis Hugh L | $115,000 | -- |
Source: Public Records
Mortgage History
| Date | Status | Borrower | Loan Amount |
|---|---|---|---|
| Open | Bliss Robert C | $154,846 | |
| Previous Owner | Yarbrough Paul M | $104,500 | |
| Previous Owner | Lewis Hugh L | $80,000 |
Source: Public Records
Tax History Compared to Growth
Tax History
| Year | Tax Paid | Tax Assessment Tax Assessment Total Assessment is a certain percentage of the fair market value that is determined by local assessors to be the total taxable value of land and additions on the property. | Land | Improvement |
|---|---|---|---|---|
| 2025 | $697 | $122,440 | $14,000 | $108,440 |
| 2024 | $697 | $120,920 | $14,000 | $106,920 |
| 2023 | $643 | $117,840 | $14,000 | $103,840 |
| 2022 | $762 | $102,760 | $14,000 | $88,760 |
| 2021 | $718 | $77,200 | $14,000 | $63,200 |
| 2020 | $714 | $72,640 | $12,000 | $60,640 |
| 2019 | $707 | $68,520 | $12,000 | $56,520 |
| 2018 | $702 | $64,160 | $10,800 | $53,360 |
| 2016 | $1,759 | $50,800 | $10,000 | $40,800 |
| 2015 | $1,615 | $45,960 | $8,000 | $37,960 |
| 2014 | $1,593 | $45,040 | $10,000 | $35,040 |
Source: Public Records
Map
Nearby Homes
- 376 Cattlemans Cir
- 121 Ducati Dr
- 732 New Hope Rd
- 690 Laney Rd
- 290 New Hope Rd
- 813 S Ola Rd
- S S Laney Rd
- 125 Karen Dr
- 0 S Ola Rd Unit 10563258
- 225 Laney Ct
- 175 Laney Ct Unit 1
- 125 Laney Ct
- 888 Laney Rd
- 976 S Laney Rd
- 1003 Ola Dale Dr
- 200 Pine Tree Ln
- 95 Pine Tree Dr
- 845 Graeme Dr
- 812 Graeme Dr
- 215 Laney Rd
- 355 Cattlemans Cir
- 351 Cattlemans Cir
- 354 Cattlemans Cir
- 357 Cattlemans Cir
- 352 Cattlemans Cir
- 356 Cattlemans Cir
- 345 Cattlemans Cir
- 350 Cattlemans Cir
- 339 Cattlemans Cir
- 358 Cattlemans Cir
- 325 Cattlemans Cir
- 359 Cattlemans Cir Unit 3
- 323 Cattlemans Cir
- 327 Cattlemans Cir
- 321 Cattlemans Cir
- 348 Cattlemans Cir
- 335 Cattlemans Cir
- 360 Cattlemans Cir
- 361 Cattlemans Cir
- 342 Cattlemans Cir