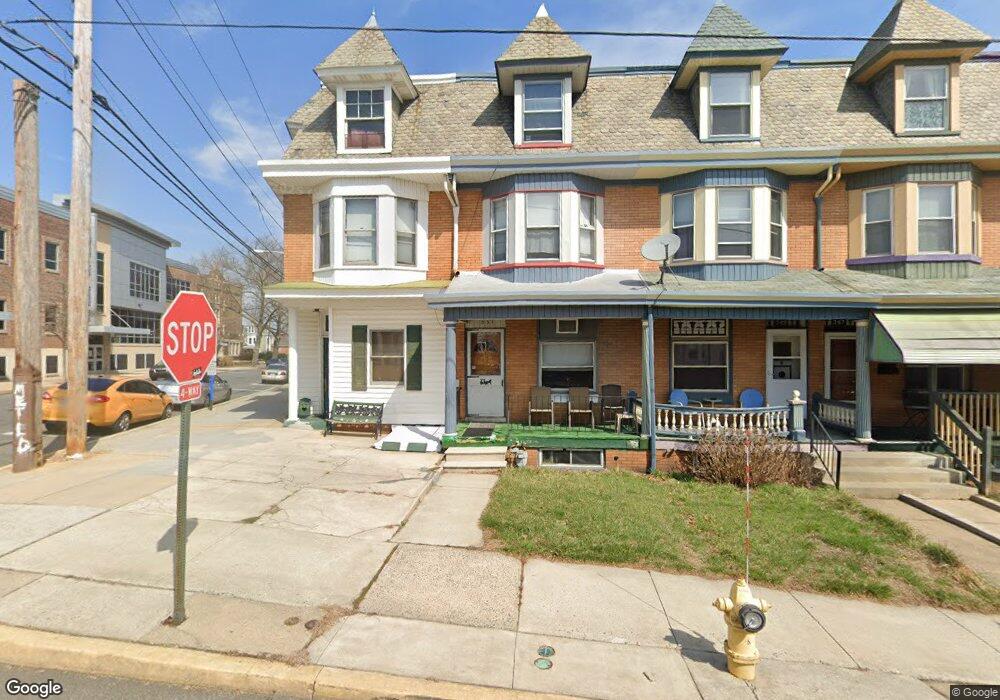
353 Chestnut St West Reading, PA 19611
Estimated Value: $261,294 - $327,000
5
Beds
1
Bath
2,296
Sq Ft
$126/Sq Ft
Est. Value
About This Home
This home is located at 353 Chestnut St, West Reading, PA 19611 and is currently estimated at $289,574, approximately $126 per square foot. 353 Chestnut St is a home located in Berks County with nearby schools including West Reading Elementary Center, Wyomissing Hills Elementary Center, and Wyomissing Area Junior-Senior High School.
Ownership History
Date
Name
Owned For
Owner Type
Purchase Details
Closed on
Dec 13, 2019
Sold by
Coleman Kevin P and Estate Of Justine M Coleman
Bought by
Coleman Kevin P and Coleman Sean P
Current Estimated Value
Purchase Details
Closed on
May 26, 1976
Bought by
Coleman Thomas L and Coleman Justine M
Create a Home Valuation Report for This Property
The Home Valuation Report is an in-depth analysis detailing your home's value as well as a comparison with similar homes in the area
Home Values in the Area
Average Home Value in this Area
Purchase History
| Date | Buyer | Sale Price | Title Company |
|---|---|---|---|
| Coleman Kevin P | -- | None Available | |
| Coleman Thomas L | -- | -- |
Source: Public Records
Tax History Compared to Growth
Tax History
| Year | Tax Paid | Tax Assessment Tax Assessment Total Assessment is a certain percentage of the fair market value that is determined by local assessors to be the total taxable value of land and additions on the property. | Land | Improvement |
|---|---|---|---|---|
| 2025 | $2,148 | $95,000 | $18,800 | $76,200 |
| 2024 | $5,251 | $95,000 | $18,800 | $76,200 |
| 2023 | $3,485 | $95,000 | $18,800 | $76,200 |
| 2022 | $4,874 | $95,000 | $18,800 | $76,200 |
| 2021 | $4,789 | $95,000 | $18,800 | $76,200 |
| 2020 | $4,649 | $95,000 | $18,800 | $76,200 |
| 2019 | $4,553 | $95,000 | $18,800 | $76,200 |
| 2018 | $4,424 | $95,000 | $18,800 | $76,200 |
| 2017 | $4,326 | $95,000 | $18,800 | $76,200 |
| 2016 | $1,394 | $95,000 | $18,800 | $76,200 |
| 2015 | $1,394 | $95,000 | $18,800 | $76,200 |
| 2014 | $1,347 | $95,000 | $18,800 | $76,200 |
Source: Public Records
Map
Nearby Homes
- 330 Kline St
- 415 Franklin St
- 529 Chestnut St
- 206 Chestnut St
- 220 S 2nd Ave
- 406 Reading Ave
- 331 Sunset Rd
- 149 Tulpehocken Ave
- 409 Walnut St
- 218 Silk Dr
- 305 Tulpehocken Ave
- 105 S Park Rd
- 430 W Greenwich St
- 518 Gordon St
- 267 N Front St
- 547 Tulpehocken St
- 233 Pear St
- 305 N Front St
- 21 S 3rd St
- 516 Schuylkill Ave