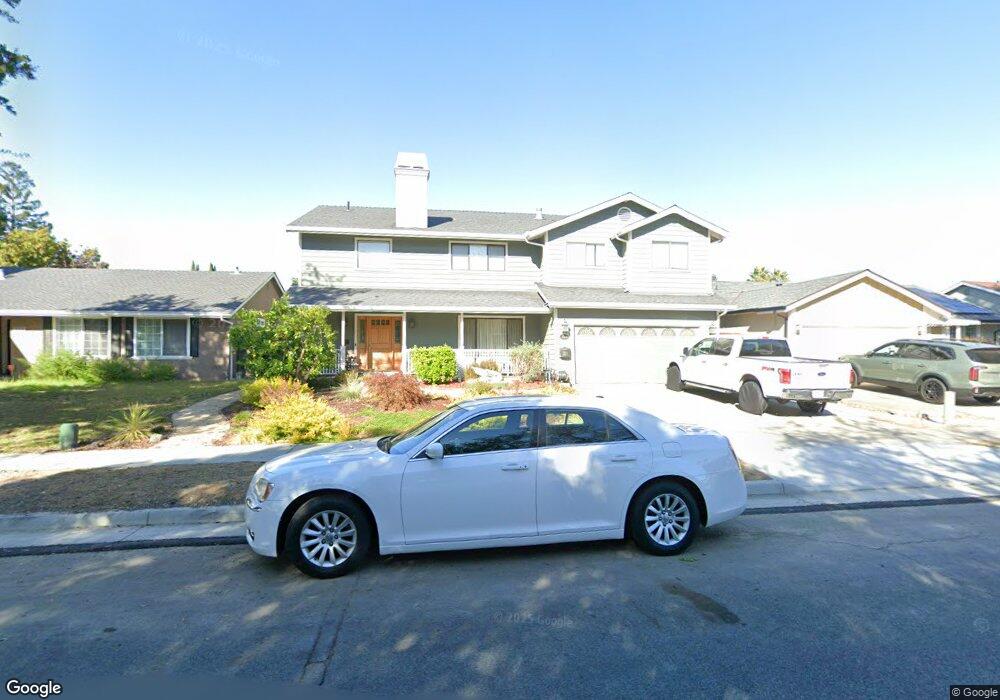
353 Conestoga Way San Jose, CA 95123
Oak Ridge NeighborhoodEstimated Value: $1,623,000 - $1,902,000
5
Beds
3
Baths
930
Sq Ft
$1,902/Sq Ft
Est. Value
About This Home
This home is located at 353 Conestoga Way, San Jose, CA 95123 and is currently estimated at $1,768,806, approximately $1,901 per square foot. 353 Conestoga Way is a home located in Santa Clara County with nearby schools including Oak Ridge Elementary School, Herman (Leonard) Intermediate School, and Santa Teresa High School.
Ownership History
Date
Name
Owned For
Owner Type
Purchase Details
Closed on
Nov 14, 2023
Sold by
Ruf Gregory J and Ruf Delia E
Bought by
Ruf Family Trust and Ruf
Current Estimated Value
Create a Home Valuation Report for This Property
The Home Valuation Report is an in-depth analysis detailing your home's value as well as a comparison with similar homes in the area
Home Values in the Area
Average Home Value in this Area
Purchase History
| Date | Buyer | Sale Price | Title Company |
|---|---|---|---|
| Ruf Family Trust | -- | None Listed On Document |
Source: Public Records
Tax History Compared to Growth
Tax History
| Year | Tax Paid | Tax Assessment Tax Assessment Total Assessment is a certain percentage of the fair market value that is determined by local assessors to be the total taxable value of land and additions on the property. | Land | Improvement |
|---|---|---|---|---|
| 2025 | $5,911 | $356,653 | $58,883 | $297,770 |
| 2024 | $5,911 | $349,661 | $57,729 | $291,932 |
| 2023 | $5,791 | $342,806 | $56,598 | $286,208 |
| 2022 | $5,754 | $336,086 | $55,489 | $280,597 |
| 2021 | $5,630 | $329,497 | $54,401 | $275,096 |
| 2020 | $5,477 | $326,120 | $53,844 | $272,276 |
| 2019 | $5,337 | $319,727 | $52,789 | $266,938 |
| 2018 | $5,285 | $313,458 | $51,754 | $261,704 |
| 2017 | $5,208 | $307,313 | $50,740 | $256,573 |
| 2016 | $4,958 | $301,289 | $49,746 | $251,543 |
| 2015 | $4,846 | $296,764 | $48,999 | $247,765 |
| 2014 | $4,276 | $290,952 | $48,040 | $242,912 |
Source: Public Records
Map
Nearby Homes
- 401 Henderson Dr
- 6129 Glen Harbor Dr
- 471 Tovar Dr
- 5968 Sorrel Ave
- 5991 Sorrel Ave
- 6239 Mahan Dr
- 379 Roan St
- 5865 Paddon Cir
- 394 Bay St
- 497 Curie Dr
- 6273 Mountford Dr
- 0 Deer Valley Rd Unit 225017975
- 579 Suisse Dr
- 482 Calero Ave
- 343 Nature Dr
- 6449 Curie Ct
- 259 Omira Dr
- 6298 Snell Ave
- 5693 Makati Cir Unit D
- 233 Omira Dr
- 351 Conestoga Way
- 355 Conestoga Way
- 348 Surber Dr
- 352 Surber Dr
- 349 Conestoga Way Unit 1
- 349 Conestoga Way
- 357 Conestoga Way
- 346 Surber Dr
- 354 Surber Dr
- 352 Conestoga Way
- 354 Conestoga Way
- 347 Conestoga Way
- 342 Surber Dr
- 350 Conestoga Way
- 359 Conestoga Way
- 358 Surber Dr
- 356 Conestoga Way
- 348 Conestoga Way
- 358 Conestoga Way
- 340 Surber Dr