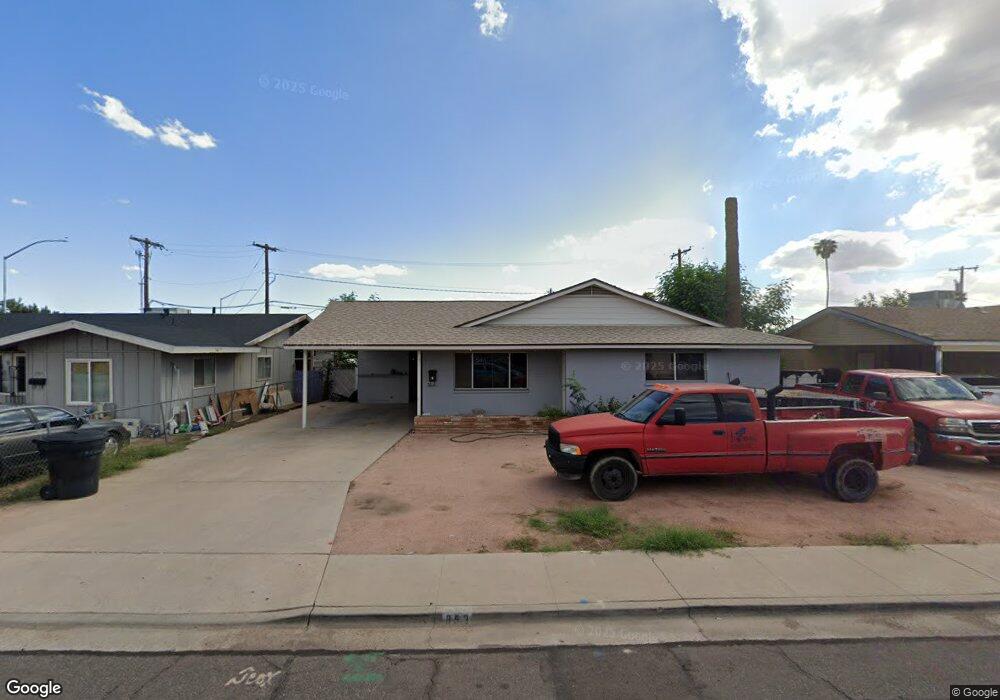
353 E 9th Dr Mesa, AZ 85210
Woodbridge Crossing NeighborhoodEstimated Value: $279,338 - $387,000
Studio
2
Baths
1,454
Sq Ft
$232/Sq Ft
Est. Value
About This Home
This home is located at 353 E 9th Dr, Mesa, AZ 85210 and is currently estimated at $337,585, approximately $232 per square foot. 353 E 9th Dr is a home located in Maricopa County with nearby schools including Lincoln Elementary School, Franklin at Brimhall Elementary School, and Franklin West Elementary School.
Ownership History
Date
Name
Owned For
Owner Type
Purchase Details
Closed on
Nov 29, 2001
Sold by
Mohammed Abdulaziz Nurhussien
Bought by
Mohammed Abdulazaz Nurhussien and Mossa Saadia Mohammed Salih
Current Estimated Value
Home Financials for this Owner
Home Financials are based on the most recent Mortgage that was taken out on this home.
Original Mortgage
$53,500
Interest Rate
6.63%
Purchase Details
Closed on
Nov 26, 2001
Sold by
Mossa Saadia Mohammed Salih
Bought by
Mohammed Abdulaziz Nurhussien
Home Financials for this Owner
Home Financials are based on the most recent Mortgage that was taken out on this home.
Original Mortgage
$53,500
Interest Rate
6.63%
Purchase Details
Closed on
Oct 6, 1994
Sold by
Vankempen Robert C and Vankempen Julie T
Bought by
Mohammed Abdulaziz Nurhussien and Mossa Saadia Mohammed Salih
Create a Home Valuation Report for This Property
The Home Valuation Report is an in-depth analysis detailing your home's value as well as a comparison with similar homes in the area
Home Values in the Area
Average Home Value in this Area
Purchase History
| Date | Buyer | Sale Price | Title Company |
|---|---|---|---|
| Mohammed Abdulazaz Nurhussien | -- | -- | |
| Mohammed Abdulaziz Nurhussien | -- | Fidelity National Title | |
| Mohammed Abdulaziz Nurhussien | -- | Fidelity National Title | |
| Mohammed Abdulaziz Nurhussien | $57,200 | Security Title Agency |
Source: Public Records
Mortgage History
| Date | Status | Borrower | Loan Amount |
|---|---|---|---|
| Closed | Mohammed Abdulaziz Nurhussien | $53,500 |
Source: Public Records
Tax History
| Year | Tax Paid | Tax Assessment Tax Assessment Total Assessment is a certain percentage of the fair market value that is determined by local assessors to be the total taxable value of land and additions on the property. | Land | Improvement |
|---|---|---|---|---|
| 2025 | $848 | $8,598 | -- | -- |
| 2024 | $851 | $8,189 | -- | -- |
| 2023 | $851 | $23,810 | $4,760 | $19,050 |
| 2022 | $833 | $17,900 | $3,580 | $14,320 |
| 2021 | $844 | $16,780 | $3,350 | $13,430 |
| 2020 | $832 | $15,100 | $3,020 | $12,080 |
| 2019 | $778 | $13,960 | $2,790 | $11,170 |
| 2018 | $746 | $12,000 | $2,400 | $9,600 |
| 2017 | $724 | $10,980 | $2,190 | $8,790 |
| 2016 | $711 | $9,910 | $1,980 | $7,930 |
| 2015 | $568 | $8,710 | $1,740 | $6,970 |
Source: Public Records
Map
Nearby Homes
- 245 E 9th Ave
- 952 S Ashland
- 421 E 6th Dr
- 715 E 8th Ave
- 408 E Garnet Ave
- 1320 S Pomeroy
- 526 S Mesa Dr
- 1262 S Jay Cir
- 523 S Pasadena -- S Unit 111
- 523 S Pasadena -- S Unit 113
- 523 S Pasadena -- S Unit 112
- 523 S Pasadena -- S Unit 116
- 523 S Pasadena -- S Unit 114
- 523 S Pasadena -- S Unit 115
- 455 S Mesa Dr Unit 104
- 849 S Coleman
- 68 W 10th Ave
- 427 E Crescent Ave
- 454 S Pioneer
- 1310 S Pima Unit 43
Your Personal Tour Guide
Ask me questions while you tour the home.