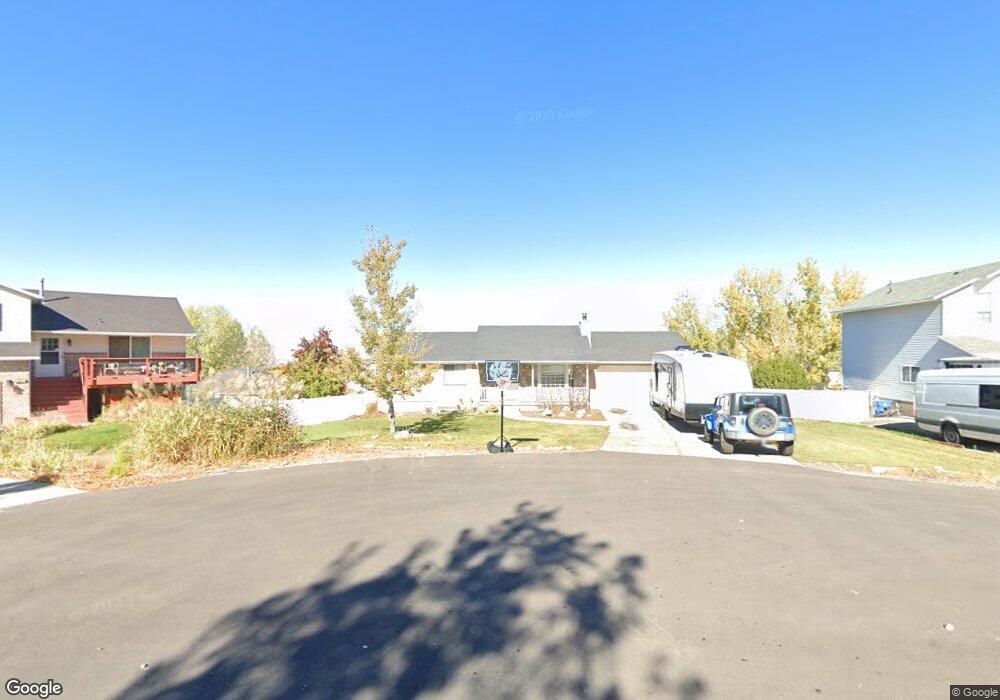
353 E Ocampo Ln Payson, UT 84651
Estimated Value: $503,000 - $567,000
6
Beds
3
Baths
2,668
Sq Ft
$201/Sq Ft
Est. Value
About This Home
This home is located at 353 E Ocampo Ln, Payson, UT 84651 and is currently estimated at $536,708, approximately $201 per square foot. 353 E Ocampo Ln is a home located in Utah County with nearby schools including Foothills Elementary School, Valley View Middle School, and Salem Junior High School.
Ownership History
Date
Name
Owned For
Owner Type
Purchase Details
Closed on
Mar 23, 2015
Sold by
Fisher Kevin Boyd
Bought by
Johnson Steven and Johnson Jody
Current Estimated Value
Home Financials for this Owner
Home Financials are based on the most recent Mortgage that was taken out on this home.
Original Mortgage
$196,377
Outstanding Balance
$154,823
Interest Rate
4.5%
Mortgage Type
FHA
Estimated Equity
$381,885
Purchase Details
Closed on
Nov 2, 2012
Sold by
Fisher Kevin B
Bought by
Boyd Keivn
Purchase Details
Closed on
Mar 19, 1999
Sold by
Nelson Thomas
Bought by
Fisher Kevin B and Fisher Lynnette R
Home Financials for this Owner
Home Financials are based on the most recent Mortgage that was taken out on this home.
Original Mortgage
$593,000
Interest Rate
6.73%
Purchase Details
Closed on
May 4, 1998
Sold by
Weishar Daniel P and Weishar Melinda I
Bought by
Nelson Thomas
Home Financials for this Owner
Home Financials are based on the most recent Mortgage that was taken out on this home.
Original Mortgage
$75,900
Interest Rate
7.05%
Create a Home Valuation Report for This Property
The Home Valuation Report is an in-depth analysis detailing your home's value as well as a comparison with similar homes in the area
Home Values in the Area
Average Home Value in this Area
Purchase History
| Date | Buyer | Sale Price | Title Company |
|---|---|---|---|
| Johnson Steven | -- | Title West | |
| Boyd Keivn | -- | None Available | |
| Fisher Kevin B | -- | Old Republic Title Company | |
| Nelson Thomas | -- | -- |
Source: Public Records
Mortgage History
| Date | Status | Borrower | Loan Amount |
|---|---|---|---|
| Open | Johnson Steven | $196,377 | |
| Previous Owner | Fisher Kevin B | $593,000 | |
| Previous Owner | Nelson Thomas | $75,900 |
Source: Public Records
Tax History
| Year | Tax Paid | Tax Assessment Tax Assessment Total Assessment is a certain percentage of the fair market value that is determined by local assessors to be the total taxable value of land and additions on the property. | Land | Improvement |
|---|---|---|---|---|
| 2025 | $2,419 | $269,225 | -- | -- |
| 2024 | $2,419 | $248,490 | $0 | $0 |
| 2023 | $2,399 | $247,170 | $0 | $0 |
| 2022 | $2,454 | $248,820 | $0 | $0 |
| 2021 | $2,084 | $326,800 | $123,000 | $203,800 |
| 2020 | $1,974 | $300,400 | $102,500 | $197,900 |
| 2019 | $1,771 | $274,600 | $102,500 | $172,100 |
| 2018 | $1,819 | $270,100 | $100,200 | $169,900 |
| 2017 | $1,724 | $136,620 | $0 | $0 |
| 2016 | $1,573 | $121,660 | $0 | $0 |
| 2015 | $1,440 | $109,230 | $0 | $0 |
| 2014 | $1,382 | $105,380 | $0 | $0 |
Source: Public Records
Map
Nearby Homes
- 359 E Magellan Ln N
- 331 E Park Dr
- 650 E Bridger Ln
- 617 E Longview Dr Unit 7
- 555 E Longview Dr Unit 30
- 591 E Longview Dr Unit 6
- 44 S Astor Ln
- 607 N Mountain View Dr
- 116 S Canyon View Dr
- 672 E Birch Ln Unit 79
- 672 E Birch Ln
- 627 Birch Ln
- 853 N Sage
- 75 S Hillside Dr
- 659 E Birch Ln Unit 67
- 715 E Birch Ln Unit 64
- 618 E Birch Ln Unit 76
- 675 E Birch Ln Unit 66
- 632 E Birch Ln Unit 77
- 656 E Birch Ln Unit 78
- 375 E Ocampo Ln
- 341 E Ocampo Ln
- 382 E Magellan Ln
- 356 E Magellan Ln
- 412 E Magellan Ln
- 344 E Ocampo Ln
- 346 E Magellan Ln
- 431 E Ocampo Ln
- 310 N Cortez Dr
- 391 E Park Dr
- 282 N Cortez Dr
- 278 N Cortez Dr
- 332 E Magellan Ln
- 438 E Ocampo Ln
- 438 E Magellan Ln
- 375 E Park Dr
- 437 E Park Dr
- 455 E Ocampo Ln
- 339 E Magellan Ln
- 359 E Magellan S
Your Personal Tour Guide
Ask me questions while you tour the home.