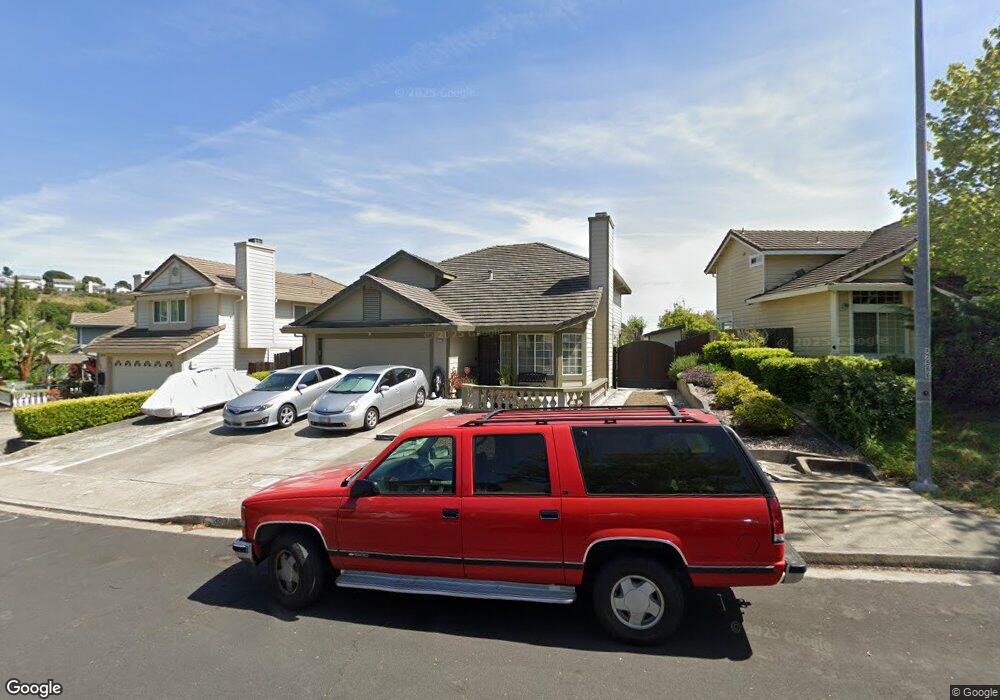
353 Foulkstone Way Vallejo, CA 94591
Glen Cove NeighborhoodEstimated Value: $657,756 - $784,000
4
Beds
3
Baths
1,935
Sq Ft
$365/Sq Ft
Est. Value
About This Home
This home is located at 353 Foulkstone Way, Vallejo, CA 94591 and is currently estimated at $706,939, approximately $365 per square foot. 353 Foulkstone Way is a home located in Solano County with nearby schools including Glen Cove Elementary, Jesse M. Bethel High School, and Vallejo Charter School.
Ownership History
Date
Name
Owned For
Owner Type
Purchase Details
Closed on
Apr 28, 2022
Sold by
Miguel Rufino A and Miguel Marylou F
Bought by
Rufino And Marylou Miguel Living Trust
Current Estimated Value
Purchase Details
Closed on
Feb 26, 1996
Sold by
Barnish Maggie M and Goseco Maggie M
Bought by
Miguel Rufino A and Miguel Marylou F
Home Financials for this Owner
Home Financials are based on the most recent Mortgage that was taken out on this home.
Original Mortgage
$144,000
Interest Rate
7.04%
Purchase Details
Closed on
Feb 5, 1996
Sold by
Goseco Jose F
Bought by
Barnish Maggie M and Goseco Maggie M
Home Financials for this Owner
Home Financials are based on the most recent Mortgage that was taken out on this home.
Original Mortgage
$144,000
Interest Rate
7.04%
Purchase Details
Closed on
Feb 24, 1994
Sold by
Goseco Jose F
Bought by
Goseco Maggie M
Create a Home Valuation Report for This Property
The Home Valuation Report is an in-depth analysis detailing your home's value as well as a comparison with similar homes in the area
Home Values in the Area
Average Home Value in this Area
Purchase History
| Date | Buyer | Sale Price | Title Company |
|---|---|---|---|
| Rufino And Marylou Miguel Living Trust | -- | -- | |
| Miguel Rufino A | $180,000 | Fidelity National Title | |
| Barnish Maggie M | -- | Fidelity National Title | |
| Barnish Maggie M | -- | -- | |
| Goseco Maggie M | -- | -- |
Source: Public Records
Mortgage History
| Date | Status | Borrower | Loan Amount |
|---|---|---|---|
| Previous Owner | Miguel Rufino A | $144,000 |
Source: Public Records
Tax History Compared to Growth
Tax History
| Year | Tax Paid | Tax Assessment Tax Assessment Total Assessment is a certain percentage of the fair market value that is determined by local assessors to be the total taxable value of land and additions on the property. | Land | Improvement |
|---|---|---|---|---|
| 2025 | $4,818 | $313,307 | $107,977 | $205,330 |
| 2024 | $4,818 | $307,164 | $105,860 | $201,304 |
| 2023 | $4,551 | $301,142 | $103,785 | $197,357 |
| 2022 | $4,451 | $295,238 | $101,750 | $193,488 |
| 2021 | $4,352 | $289,450 | $99,755 | $189,695 |
| 2020 | $4,368 | $286,483 | $98,733 | $187,750 |
| 2019 | $4,239 | $280,867 | $96,798 | $184,069 |
| 2018 | $3,980 | $275,360 | $94,900 | $180,460 |
| 2017 | $3,810 | $269,962 | $93,040 | $176,922 |
| 2016 | $3,236 | $264,669 | $91,216 | $173,453 |
| 2015 | $3,193 | $260,694 | $89,846 | $170,848 |
| 2014 | $3,051 | $255,589 | $88,087 | $167,502 |
Source: Public Records
Map
Nearby Homes
- 28 Shoal Dr E
- 7 Shoal Dr E Unit 1
- 100 Shoal Dr W
- 106 Camino Del Sol
- 153 Camino Del Sol
- 130 Flying Cloud Ct
- 2012 Glen Cove Rd
- 103 Breezewalk Dr
- 180 Winter Harbor Place
- 1048 Topsail Dr
- 260 Neptunes Ct
- 611 Sea Ranch Ct Unit 6
- 100 Shoreline Place
- 108 James River Rd
- 201 James River Rd
- 173 Silverpine Ln
- 100 Bear Cove Ct
- 254 Clearview Dr
- 393 Starfish Dr
- 1201 Glen Cove Pkwy Unit 1609
- 341 Foulkstone Way
- 365 Foulkstone Way
- 325 Foulkstone Way
- 381 Foulkstone Way
- 192 Sand Dollar Dr
- 317 Foulkstone Way
- 393 Foulkstone Way
- 198 Sand Dollar Dr
- 368 Foulkstone Way
- 309 Foulkstone Way
- 360 Foulkstone Way
- 376 Foulkstone Way
- 180 Sand Dollar Dr
- 336 Foulkstone Way
- 344 Foulkstone Way
- 384 Foulkstone Way
- 352 Foulkstone Way
- 328 Foulkstone Way
- 301 Foulkstone Way
- 320 Foulkstone Way