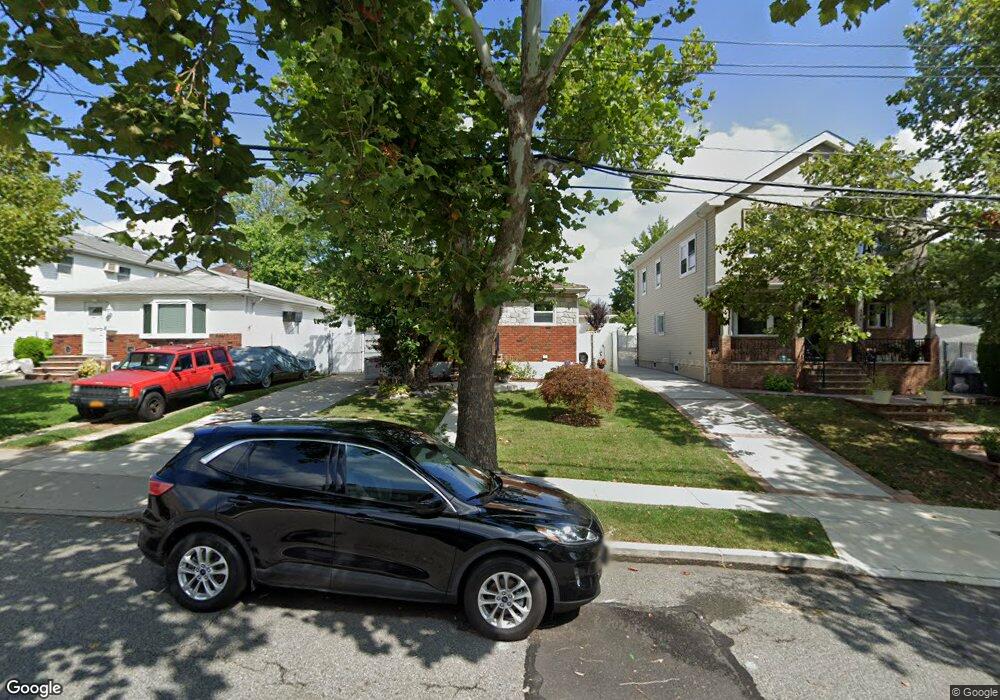
353 Genesee Ave Staten Island, NY 10312
Eltingville NeighborhoodEstimated Value: $713,421 - $820,000
3
Beds
2
Baths
960
Sq Ft
$803/Sq Ft
Est. Value
About This Home
This home is located at 353 Genesee Ave, Staten Island, NY 10312 and is currently estimated at $771,105, approximately $803 per square foot. 353 Genesee Ave is a home located in Richmond County with nearby schools including P.S. 42 The Eltingville School, I.S. 007 Elias Bernstein, and Tottenville High School.
Ownership History
Date
Name
Owned For
Owner Type
Purchase Details
Closed on
Mar 14, 2016
Sold by
Lemieux Pamela L
Bought by
Lemieux Pamela L and Napoli Frances J
Current Estimated Value
Home Financials for this Owner
Home Financials are based on the most recent Mortgage that was taken out on this home.
Original Mortgage
$70,005
Outstanding Balance
$55,353
Interest Rate
3.62%
Mortgage Type
New Conventional
Estimated Equity
$715,752
Purchase Details
Closed on
Apr 16, 2012
Sold by
Piemonte Angela A and Lemieux Pamela L
Bought by
Lemieux Pamela L
Purchase Details
Closed on
Jun 23, 2009
Sold by
Perez Samuel and Perez Dawn
Bought by
Piemonte Angela A and Lemieux Pamela L
Home Financials for this Owner
Home Financials are based on the most recent Mortgage that was taken out on this home.
Original Mortgage
$403,565
Outstanding Balance
$257,171
Interest Rate
4.93%
Mortgage Type
FHA
Estimated Equity
$513,934
Purchase Details
Closed on
Nov 14, 1996
Sold by
Martinez Raymond and Martinez Conchita
Bought by
Perez Samuel and Perez Dawn
Create a Home Valuation Report for This Property
The Home Valuation Report is an in-depth analysis detailing your home's value as well as a comparison with similar homes in the area
Home Values in the Area
Average Home Value in this Area
Purchase History
| Date | Buyer | Sale Price | Title Company |
|---|---|---|---|
| Lemieux Pamela L | -- | The Security Title Guarantee | |
| Lemieux Pamela L | -- | Homestead Title Agency | |
| Piemonte Angela A | $417,500 | None Available | |
| Perez Samuel | $172,000 | -- |
Source: Public Records
Mortgage History
| Date | Status | Borrower | Loan Amount |
|---|---|---|---|
| Open | Lemieux Pamela L | $70,005 | |
| Open | Piemonte Angela A | $403,565 |
Source: Public Records
Tax History Compared to Growth
Tax History
| Year | Tax Paid | Tax Assessment Tax Assessment Total Assessment is a certain percentage of the fair market value that is determined by local assessors to be the total taxable value of land and additions on the property. | Land | Improvement |
|---|---|---|---|---|
| 2025 | $6,516 | $41,700 | $10,390 | $31,310 |
| 2024 | $6,516 | $34,260 | $11,931 | $22,329 |
| 2023 | $6,215 | $30,604 | $9,607 | $20,997 |
| 2022 | $5,764 | $35,520 | $12,600 | $22,920 |
| 2021 | $6,076 | $31,560 | $12,600 | $18,960 |
| 2020 | $5,769 | $33,960 | $12,600 | $21,360 |
| 2019 | $5,362 | $33,240 | $12,600 | $20,640 |
| 2018 | $4,901 | $25,503 | $10,841 | $14,662 |
| 2017 | $4,605 | $24,060 | $12,600 | $11,460 |
| 2016 | $4,656 | $24,840 | $12,131 | $12,709 |
| 2015 | $4,123 | $24,192 | $10,080 | $14,112 |
| 2014 | $4,123 | $23,071 | $8,739 | $14,332 |
Source: Public Records
Map
Nearby Homes
- 3452 Richmond Ave
- 688 Leverett Ave Unit 8520
- 634 Leverett Ave
- 320 Genesee Ave
- 50 Reading Ave
- 296 Eltingville Blvd
- 292 Eltingville Blvd
- 288 Eltingville Blvd
- 284 Eltingville Blvd
- 280 Eltingville Blvd
- 457 Genesee Ave
- 71 Reading Ave
- 0 Getz Ave
- 696 Katan Ave
- 254 Ridgewood Ave
- 437 Eltingville Blvd
- 622 Barlow Ave
- 350 Bartlett Ave
- 682 Barlow Ave
- 621 Barlow Ave
- 357 Genesee Ave
- 349 Genesee Ave
- 361 Genesee Ave
- 16 Scranton Ave
- 12 Scranton Ave
- 3498 Richmond Ave
- 3502-3506 Richmond Ave
- 3502 Richmond Ave
- 365 Genesee Ave
- 3494 Richmond Ave
- 3490 Richmond Ave Unit 3492
- 3490-3492 Richmond Ave
- 24 Scranton Ave
- 20 Scranton Ave
- 369 Genesee Ave
- 3486 Richmond Ave
- 28 Scranton Ave
- 373 Genesee Ave
- 32 Scranton Ave
- 380 Genesee Ave