353 Lydia Ave Woonsocket, RI 02895
Bernon District NeighborhoodEstimated Value: $383,379 - $443,000
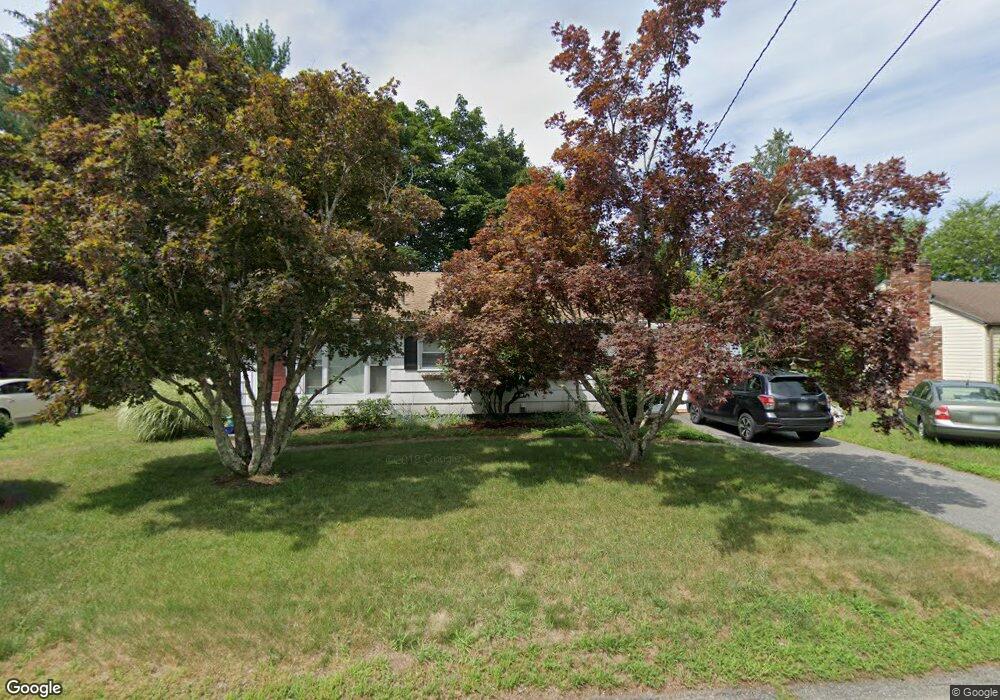
About This Home
This home is located at 353 Lydia Ave, Woonsocket, RI 02895 and is currently estimated at $400,345, approximately $417 per square foot. 353 Lydia Ave is a home located in Providence County with nearby schools including Woonsocket High School and Mount Saint Charles Academy.
Ownership History
We collect this data history from publicly available records. To have your information removed, we recommend requesting removal directly through your county’s website.
Purchase Details
Purchase Details
Home Values in the Area
Average Home Value in this Area
Purchase History
We collect this data history from publicly available records. To have your information removed, we recommend requesting removal directly through your county’s website.
| Date | Buyer | Sale Price | Title Company |
|---|---|---|---|
| $163,000 | -- | ||
| $130,000 | -- |
Mortgage History
We collect this data history from publicly available records. To have your information removed, we recommend requesting removal directly through your county’s website.
| Date | Status | Borrower | Loan Amount |
|---|---|---|---|
| Open | $159,004 | ||
| Previous Owner | $119,000 | ||
| Previous Owner | $85,000 |
Tax History
We collect this data history from publicly available records. To have your information removed, we recommend requesting removal directly through your county’s website.
| Year | Tax Paid | Tax Assessment Tax Assessment Total Assessment is a certain percentage of the fair market value that is determined by local assessors to be the total taxable value of land and additions on the property. | Land | Improvement |
|---|---|---|---|---|
| 2025 | $3,849 | $342,700 | $105,500 | $237,200 |
| 2024 | $3,258 | $224,100 | $86,000 | $138,100 |
| 2023 | $3,133 | $224,100 | $86,000 | $138,100 |
| 2022 | $3,133 | $224,100 | $86,000 | $138,100 |
| 2021 | $3,764 | $158,500 | $67,800 | $90,700 |
| 2020 | $3,804 | $158,500 | $67,800 | $90,700 |
| 2018 | $3,817 | $158,500 | $67,800 | $90,700 |
| 2017 | $4,172 | $138,600 | $63,800 | $74,800 |
| 2016 | $4,413 | $138,600 | $63,800 | $74,800 |
| 2015 | $5,070 | $138,600 | $63,800 | $74,800 |
| 2014 | $5,035 | $140,100 | $70,200 | $69,900 |
Map
- 378 Gauthier Dr
- 64 Lydia Ave
- 39 Louise St
- 264 Phillips St
- 139 Danielle Dr
- 204 Talcott St
- 154 Mount Saint Charles Ave
- 304 Getchell Ave
- 59 Cooper Ave
- 413 Manville Rd
- 0 Irving Ave Unit 1414507
- 0 Cranston St
- 77 Capwell Ave
- 869 Bernon St
- 78 Saint Joseph St
- 60 Sherman Ave
- 36 Louisquisset Pike Unit 105
- 36 Old Louisquisset Pike Unit 205
- 36 Old Louisquisset Pike Unit 109
- 36 Old Louisquisset Pike Unit 210
Ask me questions while you tour the home.