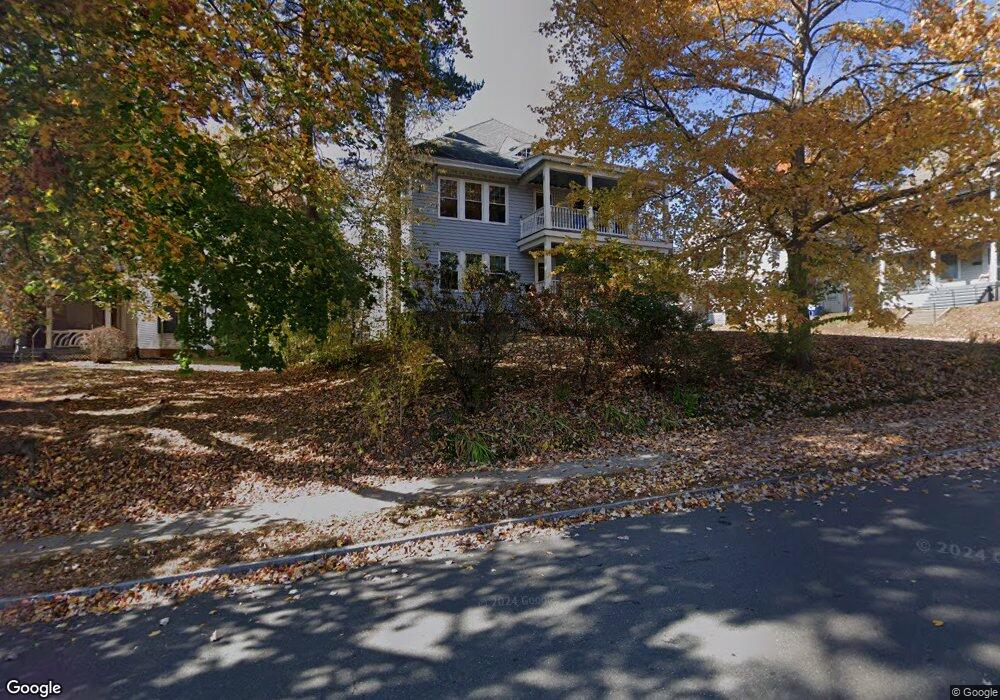
353 Main St Bristol, CT 06010
Federal Hill NeighborhoodEstimated Value: $304,628 - $465,000
6
Beds
3
Baths
3,368
Sq Ft
$116/Sq Ft
Est. Value
About This Home
This home is located at 353 Main St, Bristol, CT 06010 and is currently estimated at $391,907, approximately $116 per square foot. 353 Main St is a home located in Hartford County with nearby schools including Ellen P. Hubbell School, Chippens Hill Middle School, and Bristol Eastern High School.
Ownership History
Date
Name
Owned For
Owner Type
Purchase Details
Closed on
May 11, 2009
Sold by
Novastar Mortgage Inc
Bought by
Lass Carol
Current Estimated Value
Home Financials for this Owner
Home Financials are based on the most recent Mortgage that was taken out on this home.
Original Mortgage
$144,400
Outstanding Balance
$91,481
Interest Rate
4.9%
Estimated Equity
$300,426
Purchase Details
Closed on
Jun 30, 2004
Sold by
Coan Stephen J
Bought by
Noel Stephen
Home Financials for this Owner
Home Financials are based on the most recent Mortgage that was taken out on this home.
Original Mortgage
$118,750
Interest Rate
7.65%
Create a Home Valuation Report for This Property
The Home Valuation Report is an in-depth analysis detailing your home's value as well as a comparison with similar homes in the area
Home Values in the Area
Average Home Value in this Area
Purchase History
| Date | Buyer | Sale Price | Title Company |
|---|---|---|---|
| Lass Carol | $92,500 | -- | |
| Noel Stephen | $125,000 | -- |
Source: Public Records
Mortgage History
| Date | Status | Borrower | Loan Amount |
|---|---|---|---|
| Open | Noel Stephen | $144,400 | |
| Previous Owner | Noel Stephen | $237,500 | |
| Previous Owner | Noel Stephen | $118,750 | |
| Previous Owner | Noel Stephen | $15,000 |
Source: Public Records
Tax History
| Year | Tax Paid | Tax Assessment Tax Assessment Total Assessment is a certain percentage of the fair market value that is determined by local assessors to be the total taxable value of land and additions on the property. | Land | Improvement |
|---|---|---|---|---|
| 2025 | $5,637 | $167,020 | $29,120 | $137,900 |
| 2024 | $5,320 | $167,020 | $29,120 | $137,900 |
| 2023 | $5,069 | $167,020 | $29,120 | $137,900 |
| 2022 | $4,040 | $105,350 | $16,520 | $88,830 |
| 2021 | $4,040 | $105,350 | $16,520 | $88,830 |
| 2020 | $4,040 | $105,350 | $16,520 | $88,830 |
| 2019 | $4,009 | $105,350 | $16,520 | $88,830 |
| 2018 | $3,885 | $105,350 | $16,520 | $88,830 |
| 2017 | $3,859 | $107,100 | $31,500 | $75,600 |
| 2016 | $3,859 | $107,100 | $31,500 | $75,600 |
| 2015 | $3,707 | $107,100 | $31,500 | $75,600 |
| 2014 | $3,707 | $107,100 | $31,500 | $75,600 |
Source: Public Records
Map
Nearby Homes
Your Personal Tour Guide
Ask me questions while you tour the home.